Preface
This is a brain dump of my experience with Mapnik, the map rendering library that powers OpenStreeMap and MapOSMatic, among other things.
The documentation source code for this "missing manual" is available on GitHub and is licensed under the FreeBSD Documentation License.
Why yet another documentation project?

There are different information sources that document certain aspects of Mapnik, but none are really complete, up to date, and easily understandable at the same time …
Other existing documentation efforts for Mapnik are:
- GitHub Wiki
-
The Mapnik Wiki on GitHub is a weird mix of end user and developer documentation that unfortunately is neither complete nor up to date.
It is also considered dead according to GitHub issue #3543: "Cancel, abolish, destroy the Wiki"
- Sphinx Docs
-
The Sphinx Docs project was an attempt to create a Mapnik manual using the Sphinx Documentation Generator, but this project unfortunately never really got anywhere and has seen no update for the last ten years now.
- Doxygen
-
The mapnik source code contains structured comments from which API reference documentation can be generated using Doxygen. Generated output can be found online, but is not necessarily fully up to date.
- API reference
-
There is also versioned API reference documentation maintained outside of the main Mapnik source, in the separate Mapnik Reference project.
- XML reference
-
There’s a XML reference PDF created by David Eastcott, but it was written for Mapnik v0.7, while we’re at v3.0.23 at the time of this writing, so it’s really outdated by now.
|
Note
|
This list most likely isn’t complete … |
Why still bother with Mapnik at all?
Even though its development has slowed down quite a bit in recent years, and client side vector tile rendering receives much more love these days, and even Mapnik XML style files are somewhat out of fashion in favor of writing styles using CartoCSS and then converting that to Mapnik XML automatically, there are still many open source Mapnik styles in use out there, especially the Openstreetmap Carto style used for the default Openstreetmap map tiles.
Also for rendering printable formats, which I’m especially interested in, the Mapnik/CairoGraphics tool chain still seems to be a better choice than the OpenGL based vector tile approaches.
The MapOSMatic instance that I’m running makes intensive use of Mapnik not only being able to render PNG tiles, but also bigger documents in both bitmap and vector formats. Especially the capability of rendering into a Cairo Graphis surface comes in handy for this.
Why AsciiDoc(tor)?
For someone like me, who comes from a DocBook background (I wrote and translated for the PHP manual, and implemented parts of its translation infrastructure, a long time ago, and also worked with a DocBook generated manual a lot in my MySQL days), AsciiDoc feels more "natural" than MarkDown (which is more single document focussed and not really targeting whole books), or Sphinx to me.
1. Introduction
Mapnik is a Free Toolkit for developing mapping applications. It is written in modern C++ and has Python bindings that support fast-paced agile development. It can comfortably be used for both desktop map design and web development.
1.1. Concept
Mapnik is a library, not a complete application program. So it always to be linked to at least a minimum of application code that controls the library operations.
The data flow of Mapnik basically is that it reads geospatial data sources and applies presentation styles on the input that decide how to visually present specific geometry objects:
In a little more detailed view, starting bottom up from the output side, we have the following basic library objects:
-
Symbolizers do the actual output, by taking a geometry and its extra properties and creating actual graphic output from that
-
Filters decide what to actually pass to specific symbolizers instances for output
-
Rules contain one or more filters
-
Styles contain one or more rules
-
Data sources provide actual geometry objects to process
-
Layers combine a data source with one or more styles
-
A map contains one or more layers
TODO: class diagram
All these objects can be created and configured directly in code, but the usual approach is to so by specifying them in a XML style file which is then loaded as a whole into a Mapnik map object at run time.
In the most simple case the application program just creates a Mapnik Map object of a certain size, loads a XML style file, and renderers this style into an output file, e.g. when using the Python Mapnik bindings:
Python API code:
#! /usr/bin/env /usr/bin/python3

import mapnik

map = mapnik.Map(600,300) # create a 600x300 pixel map

mapnik.load_map(map, 'points.xml') # loat style file

map.zoom_all() # make sure all data is visible
map.zoom(-1.1) # zoom out a bit more to avoid clipping

mapnik.render_to_file(map, 'point.png', 'png') # render
Style file including inline data:
<?xml version="1.0" encoding="utf-8"?>
<Map background-color='lightgreen'>

  <Style name="style">
    <Rule>
      <PointSymbolizer/>
    </Rule>
  </Style>

  <Layer name="layer">
    <StyleName>style</StyleName>
    <Datasource>
      <Parameter name="type">csv</Parameter>
      <Parameter name="inline">
wkt
"POINT(10 10)"
"POINT(20 20)"
"POINT(30 30)"
      </Parameter>
    </Datasource>
  </Layer>

</Map>
Result:

TODO: do the same with pure python and no separate style file
2. Installation
How to install Mapnik …
2.1. Linux
2.1.1. Debian / Ubuntu
TODO
2.1.2. Others
TODO
2.1.3. Python / PIP
TODO
2.2. Windows
TODO
2.3. MacOS
TODO
3. Mapnik XML
|
Note
|
For now I’ll only cover how to create styles using Mapnik XML style files. Documentation of other style file formats, like CartoCSS, or how to create styles purely programatically using C++ or Python code, will have to wait until the XML format documentation is complete, or for someone else to volunteer doing this. |
3.1. Map
This is the top level tag / object in a mapnik setup, it defines the map extent and global parameters / defaults.
TODO: contains …
| Attribute | Type | Default | Description |
|---|---|---|---|
|
string |
none |
name of a <FileSource> to find the input file in |
color |
transparent |
||
file path |
none |
||
|
SVG composition |
none |
|
|
float |
1.0 |
|
|
proj4 projection |
+proj=longlat +ellps=WGS84 +datum=WGS84 +no_defs |
|
|
float |
0.0 |
|
|
4xfloat |
||
|
directory path |
none |
|
version string |
none |
||
boolean |
true |
Whether relative paths are relative to the directory the XML file is in, or the current working directory. |
3.1.1. backgroud-color attribute
<?xml version="1.0" encoding="utf-8"?>
<Map background-color="red">
</Map>
3.1.2. backgroud-image attribute
Sets a background image for the map. The image is not scaled to the actual map output size, if the two sizes do not match it is either cropped or tiled.
<?xml version="1.0" encoding="utf-8"?>
<Map background-image="../images/xkcd-standards.png">
</Map>
3.1.3. minimum-version attribute
Specifies the minimum Mapnik version needed to process this stylesheet.
Requires a three part version number, so 3.0.0 works but 3.0 or just 3 doesn’t. (See also https://github.com/mapnik/mapnik/issues/4369)
TODO: wiki says it prints a warning only, but at least with the Python bindings it causes a hard runtime error instead.
<?xml version="1.0" encoding="utf-8"?>
<Map minimum-version="3.0.0">
</Map>
3.1.4. paths-from-xml attribute
Specifies whether relative file paths are relative to the top level Mapnik XML file (true) or the local directory (false).
Defaults to true.
3.2. DataSource
A <Datasource> can appear in two places: as a named data surce template under <Map> or as an actual data source in a <Layer>. A data soure template can provide default values for actual layer data sources, e.g. when using a PostGis database as data source a data source template can provide all the connection parameters, so that actual layer data sources only have to provide actual SQL queries.
Example:
<Map>
  <!-- Datasource template -->
  <Datasource name="gis">
    <Parameter name="type">postgis</Parameter>
    <Parameter name="host">gis-db</Parameter>
    <Parameter name="port">5432</Parameter>
    <Parameter name="dbname">gis</Parameter>
    <Parameter name="user">maposmatic</Parameter>
    <Parameter name="password">secret</Parameter>
  </Datasource>

  <!-- actual Datasource using the template above for default values -->
  <Layer name="layer-1">
    <Datasource base="gis">
      <Parameter name="table">
`       SELECT ...
      </Parameter>
    </Datasource>
  </Layer>
</Map>
Mapnik supports several different kinds of data sources, and actually has a plugin interface for these, so that plugins for more data sources can be added "on the fly" without having to rebuild Mapnik itself.
The set of plugins that come with Mapnik itself are caled core plugins. Some former core plugins that are no longer maintained, or never left experimental status, have been moved to a separate non-core plugins repository, and there is also a small number of plugins by outside contributores, which we will refer to as exra data sources below.
3.2.1. Core data sources
The core plugins are part of the mapnik source code itself, and usually avaliable in all builds of the mapnik library. (TODO: add link to mappnik github).
CSV
The CSV plugin reads simple column separated data from a file when specified using the file parameter, or directly from the XML style file when using the inline paramter. In the later case all lines following the inline parameter tag will be read as CSV input until the closing paramter tag is reached. In case that the inline data contains <, > or & characters, you should enclose it in a <![CDATA[…]]> section to prevent the content from being interpreted as XML.
When giving a file path, this is taken as relative to the directory the style file is in, unless a base parameter is given. In that case a relative file path will be interpreted as relative to the directory path given in the <FileSource> of that base name.
Processig performance can be improved by creating an additional .index index file using the [mapnik-index] tool.
<!-- read from file path/to/file.csv -->
<DataSource>
  <Parameter name="type">csv</Parameter>
  <Parameter name="file">path/to/file.csv</Parameter>
</DataSource>

<!-- read inline data -->
<DataSource>
  <Parameter name="type">csv</Parameter>
  <Parameter name="inline"><![CDATA[
lat,lon,text
52.0,8.5,"Bielefeld"
  ]]></Parameter>
</DataSource>
By default the CSV plugin tries to identify the field delimiter by looking at the first line of the file, checking for , ; | and the TAB character. Whatever of these characters seen the most often is considered the separator character, unless you specifcy a different one with the separator Parameter explicitly, e.g: <Parameter name="separator">;</Parameter>.
In cases where the data does not contain a header line, one can be given as content of the headers parameter.
The default quoting and escape characters are " and \, but can be changed with the quote and escape parameters.
Line endings are auto detected, too, so files with DOS/Windows (\r\n), Linux/Unix (\n) or MacOS (\r) style line endings are read correctly out of the box.
The CSV plugin assumes that the data it reads is UTF-8 encoded, a different encoding can be specified using the encoding parameter.
Column data can be referred to by the columns header name, using [column_name] placeholders in expressions. The following column names have a special meaning and are used to retrieve actual geometry data for a line:
latorlatitude-
Point latitude
lon,lng,long, orlongitude-
Point longitude
wkt-
Geometry data in Well Known Text format
geojson-
Geometry data in GeoJSON format
So each input file either needs a lat/lon column pair, or either a wkt or geojson column to be used as a Mapnik data source.
When parsing the header line fails, or no geometry column(s) can be detected in it, the plugin will print a warning by default, and not return any data. When the strict parameter is set to true, style processing will be terminated completely by throwing a Mapnik exception.
| Parameter | Type | Default | Description |
|---|---|---|---|
|
string |
utf-8 |
Text encoding used in the CSV data |
|
int |
none |
Read only this many data rows, ignore the rest. |
|
string |
none |
Header names if the file contains none on the first line |
|
boolean |
false |
Terminate Mapnik on hitting errors? |
|
char |
|
Quote character used for string columns in the data |
|
char |
|
TODO: does this even really exist? |
|
char |
auto detected |
Field separator, typically |
|
4xfloat |
none |
ignore data that is completely outside this extent bounding box |
|
text |
none |
CSV data to be read directly from the style file |
|
file path |
none |
path of CSV file to read |
|
string |
none |
name of a |
- TODO
-
-
.indexfile support? See alsomapnik-indexutility -
NULL handling?
-
Gdal
| Parameter | Type | Default | Description |
|---|---|---|---|
|
|||
|
string |
none |
name of a |
|
|||
|
|||
|
|||
|
|||
|
|||
|
GeoJSON
While the GeoJSON format is also supported by the OGR input plugin, a direct native GeoJSON plugin was added for performance reasons for this more and more common format.
Processig performance can be improved by creating an additional .index index file using the [mapnik-index] tool.
| Parameter | Type | Default | Description base |
|---|---|---|---|
|
string |
none |
name of a |
|
boolean |
true |
|
|
string |
utf-8 |
Encoding used for textual informatin |
|
file path |
none |
Path of a GeoJSON file to read for input. |
|
string |
none |
Inline GeoJSON data as part of the stylefile itself |
|
int |
5 |
How many features of a feature set to read up front to determine what property names exist in the data |
<?xml version="1.0" encoding="utf-8"?>
<Map background-color='white'>

  <Style name="style">
    <Rule>
      <PointSymbolizer file="symbols/[file]"/>
    </Rule>
  </Style>

  <Layer name="layer">
    <StyleName>style</StyleName>
    <Datasource>
      <Parameter name="type">geojson</Parameter>
      <Parameter name="inline"><![CDATA[
{
    "type": "FeatureCollection",
    "features": [
        {
            "type": "Feature",
            "properties": {
                "file": "dot.svg"
            },
            "geometry": {
                "type": "Point",
                "coordinates": [1, 1]
            }
        },
        {
            "type": "Feature",
            "properties": {
                "file": "bug.svg"
            },
            "geometry": {
                "type": "Point",
                "coordinates": [2, 1]
            }
        }
    ]
}
      ]]></Parameter>
    </Datasource>
  </Layer>

</Map>
OGR
The OGR input plugin supports a large number of different vector formats via the GDAL/OGR library. For a complete list of supported formats see the Vector Drivers list in the GDAL documentation.
The OGR plugin is typically used for GPX — for which no special input plugin exists — and OSM data — for which it replaced the older OSM plugin that has now been moved to the non-core-plugins repository and is usally not included in Mapnik binary builds anymore. So we’re going into details for these two data formats below only.
| Parameter | Type | Default | Description |
|---|---|---|---|
|
string |
none |
name of a |
|
string |
auto detect |
actual vector format driver to use |
|
string |
utf-8 |
|
|
|||
|
file path |
none |
path of input file to read |
|
string |
none |
inline vector file data to read directly from style file |
|
string |
none |
name of the input layer to actually process |
|
int |
none |
number of the input layer to actually process |
|
|||
|
string |
none |
alias for |
OGR GPX
The GPX backend reads GPX XML files and provides the contained data via the following five layers:
- routes
-
Returns routes from the GPX files
<rte>tags as lines. Each route is given an extraroute_idattribute. - tracks
-
Returns tracks from the GPX files
<trk>/<trkseg>tags as multilines. Each track is given an extratrack_idattribute. - route_points
-
Returns
<rtept>route points from all routes, with an extraroute_fidfiled referring to theroute_idof the route that a point belongs to. - track_points
-
Returns
<trkpt> track points from all tracks, with extratrack_fidandtrack_seg_idattributes added. - waypoints
-
Returns a compbination of all route and track points.
Any extra tags that a route, track or point may have, like <name> or <ele> (for eleveation), can be accessed in filter expressions and symbolizers by name, e.g. as [name] or [ele].
Show a marker for all GPX points with a non-empty <name> tag.
<Style name="named_point">
  <Rule>
    <Filter>not ([name] = null or [name] = '')</Filter>
    <PointSymbolizer file="marker.svg"/>
    <TextSymbolizer face-name="DejaVu Sans Book" size="10" placement="point">[name]</TextSymbolizer>
  </Rule>
</Style>

<Layer>
  <StyleName>named_point</StyleName>
  <Datasource>
    <Parameter name="type">ogr</Parameter>
    <Parameter name="driver">gpx</Parameter>
    <Parameter name="file">file.gpx</Parameter>
    <Parameter name="layer">waypoints</Parameter>
  </Datasource>
</Layer>
For more details see the original GDAL documentation for the GPX backend
OGR OSM
The OGR plugin can read uncompressed OSM XML data andt the more compact, but not human readable, PBF format. File formats are auto detected when using the .osm or .pbf file extensions. When using files with other extensions, like e.g. .xml for OSM XML, the driver parameter needs to be set to osm explicitly.
The OSM backend provides data in the following five layers:
points-
Nodes that have significant tags attached.
lines-
Ways that are recognized as non-area.
multilinestrings-
Relations that define a multilinestring (
type=multilinestringortype=route). multipolygons-
Ways that are recognized as areas and relations that form a polygon or multipolygon (e.g.
type=multipolygonortype=boundary) other_relations-
Relations that are not in
multilinestringsormultipolygons
<Datasource>
  <Parameter name="type">ogr</Parameter>
  <Parameter name="driver">osm</Parameter>
  <Parameter name="file">ways.osm</Parameter>
  <Parameter name="layer">lines</Parameter>
</Datasource>
While rendering OSM data directly can work out OK for small amounts of data the usually preferred way to present OSM data is to import it into PostGIS using either the osm2pgsql or imposm import tool first, and then to use the PostGIS Datasource. This requires some extra effort up front, but performs better on larger data sets, and allows for more sophisticated preprocessing of the OSM input data than the few fixed rules statically built into the OGR OSM backend.
For more details see the original GDAL documentation for the OSM backend
PgRaster
| Parameter | Type | Default | Description |
|---|---|---|---|
|
|||
|
|||
|
|||
|
|||
|
|||
|
|||
|
|||
|
|||
|
|||
|
|||
|
|||
|
|||
|
|||
|
|||
|
|||
|
|||
|
|||
|
|||
|
|||
|
|||
|
|||
|
|||
|
|||
|
|||
|
PostGIS
| Parameter | Type | Default | Description |
|---|---|---|---|
|
|||
|
string |
none |
PostgreSQL server host name or address |
|
string |
none |
PostgreSQL server port |
|
string |
none |
Database user |
|
string |
none |
Database user password |
|
string |
none |
Name of database to use |
|
int |
4 |
Connect timeout in seconds |
|
boolean |
true |
Reuse connection for subsequent queries |
|
|||
|
boolean |
false |
Whether to auto detect primary key if none is given in |
|
int |
0 |
Fetch this many features at a time, or all when zero. |
|
boolean |
false |
Try to estimate the extent from the data retrieved |
|
floatx4 |
none |
Extent bounding box |
|
boolean |
false |
|
|
string |
none |
The result field that the geometry to process is in. Auto detected when not given. |
|
string |
none |
Name of table geometry is retrieved from. Auto detected when not given, but this may fail for complex queries. |
|
int |
1 |
initial connection pool size |
|
int |
0 |
|
|
int |
0 |
|
|
string |
none |
Primary key field of table geometry is retrieved from. Auto detected when not given and |
|
boolean |
true |
|
|
int |
10 |
Max. connection pool size |
|
int |
1 |
Run that many queries in parallel, must be ⇐ |
|
int |
0 |
Only return this many features if > 0 |
|
boolean |
false |
|
|
float |
1/20 |
|
|
boolean |
false |
|
|
float |
0.0 |
|
|
float |
1/40 |
|
|
int |
0 |
SRID of returned features, auto detected when zero |
|
string |
none |
Name of a table, or SQL query text |
|
float |
0.0 |
|
|
boolean |
false |
|
Aside from the basic PostgreSQL connection parameters (host, port, user, password, dbname), you can also add additional connection parameter keywords in the host or dnname parameter (probably the others, too, but this I didn’t test yet) for more fine grained connection control.
You can e.g. set a datasource specific application name with this:
<Parameter name='host'>localhost application_name=my_sytle</Parameter>Or set a specific schema search path:
<Parameter name='host'>localhost options='-c search_path=foo,public'</Parameter>Probably most important though, this allows for using SSL/TLS. In it’s most basic form you’d just enforce SSL/TLS encryption being used:
<Parameter name='host'>localhost sslmode=require</Parameter>The PostGIS datasource supports two different methods to return data to Mapnik: in regular well known binary (WKB) or — with PostGIS v2.2 or later — tiny well known binary (TWKB) format. This is controlled by the twkb_encoding option.
When using TWKB the twkb_rounding_adjustment parameter then controls the resolution the TWKB aims for. A value of 0.5 would lead to a coarseness of about one pixel, the default of 0.0 would be in the range of 0.05 to 0.2 pixels usually. This is done by using the twkb_rounding_adjustment parameter to calculate the tolerance paramter for ST_Simplify() and ST_RemoveRepeatedPoints(), and the decimaldigits_xy parater for ST_AsTWKB()
When using WKB (the default), simplification can be controlled via simplify_geometries, simplify_snap_ratio, simplify_dp_preserve, simplify_dp_ratio, simplify_prefilter, simplify_clip_resolution parameters. (TODO: describe in more detail)
simplify_clip_resolution is use for both formats, and controls at what map scale geometries start getting clipped to the rendering window when non-zero.
The following special tokens can be used in SQL queries, and will be replaced b the actual mapnik values for the current render request:
!bbox!-
the map bounding box
!scale_denominator!-
the current scale denominator
!pixel_width!,!pixel_height!-
width and height of pixels (TODO: depens on STR, is ° with latlon and meters with google mercator?)
Raster
| Parameter | Type | Default | Description |
|---|---|---|---|
|
string |
none |
name of a |
|
|||
|
|||
|
|||
|
|||
|
|||
|
|||
|
|||
|
|||
|
|||
|
|||
|
|||
|
Shape
The shape input plugin can read the ESRI shapefile format. The OGR plugin also supports shapefiles, but the shape plugin has more direct support for this. It is also better maintained and tested.
Shapefiles are often used instead of databases for data that doesn’t change that often, or where data available in a database requires some preprocessing. Common examples are boundaries, coastlines, and elevation countour lines.
OpenStreetMap or example provides land polygons, water polygons, coastlines, and antarctic ice sheet polygons and outlines as regularily updated shapefiles on the OsmData Download Server. Due to the way large bodies of land and water are constructed by grouping individual coast line segments into polygon relations in OSM, there’s always a risk of such lines not really being closed polygons. The OSM shapefiles are generated by extracting and aggregating the line segments data, and are only published when containing no unclosed polygons.
Another often used source of shapefiles is Natural Earth, which provides public domain geo data for lots of physical and cultural features.
Shapefile processing performance can be increased by creating an index file using the [shapeindex] tool that is included in the Mapnik source code, and usually also in binary distribution pacakges.
| Parameter | Type | Default | Description |
|---|---|---|---|
|
file path |
none |
shapefile path, |
|
string |
none |
name of a |
|
string |
utf-8 |
encoding used for text fields in the shapefile |
|
int |
none |
maximum number of rows to process |
<?xml version="1.0" encoding="utf-8"?>
<Map background-color='blue' srs='epsg:4326'>

  <Style name="countries">
    <Rule>
      <PolygonSymbolizer fill="green"/>
    </Rule>
  </Style>

  <Layer name="countries">
    <StyleName>countries</StyleName>
    <Datasource>
      <Parameter name="type">shape</Parameter>
      <Parameter name="file">data/ne_110m_admin_0_countries.shp</Parameter>
    </Datasource>
  </Layer>

  <Style name="gridlines">
    <Rule>
      <LineSymbolizer stroke="black" stroke-width="0.1"/>
    </Rule>
  </Style>

  <Layer name="grid">
    <StyleName>gridlines</StyleName>
    <Datasource>
      <Parameter name="type">shape</Parameter>
      <Parameter name="file">data/ne_50m_graticules_10.shp</Parameter>
    </Datasource>
  </Layer>

</Map>
SQLite
| Parameter | Type | Default | Description |
|---|---|---|---|
|
|||
|
|||
|
string |
none |
name of a |
|
|||
|
|||
|
|||
|
|||
|
|||
|
|||
|
|||
|
|||
|
|||
|
|||
|
|||
|
|||
|
|||
|
|||
|
|||
|
TopoJson
| Parameter | Type | Default | Description |
|---|---|---|---|
|
string |
none |
name of a |
|
|||
|
|||
|
3.2.2. Non-core
The following plugins used to be part of the mapnik source, but have been moved to an extra repository as they are either no longer maintained, or still experimental. These are usually not part of a standard Mapnik installation.
Geos
| Parameter | Type | Default | Description |
|---|---|---|---|
|
string |
utf-8 |
|
|
|||
|
|||
|
|||
|
|||
|
See also:
Kismet
An experimental plugin that reads WLAN location informatin from a Kismet instance.
| Parameter | Type | Default | Description |
|---|---|---|---|
|
string |
utf-8 |
Text encoding |
|
|||
|
string |
none |
Kinsmet server name or IP address |
|
int |
2501 |
Port that the Kismet process is listening on |
|
string |
See also:
OCCI
| Parameter | Type | Default | Description |
|---|---|---|---|
|
|||
|
|||
|
|||
|
|||
|
|||
|
|||
|
|||
|
|||
|
|||
|
|||
|
|||
|
|||
|
|||
|
|||
|
|||
|
|||
|
OSM
The OSM plugin is no longer maintained as the OGR plugin can read OSM data now, too, and unlike the OSM plugin not only supports the OSM XML format, but also the more compact PBF format. So the old OSM plugin is no longer considered a core plugin now.
| Parameter | Type | Default | Description |
|---|---|---|---|
|
4xfloat |
none |
no longer supported, see also |
|
string |
utf-8 |
Encoding of text fields in the data file |
|
file path |
OSM XML data file to read |
|
|
string |
libxml |
So far libxml is the only possible choice here |
|
string |
none |
Fetching OSM data from an API url was discontinued in Mapnik v2.3 |
Python
The experimental python plugin allows for writing data sources using custom Python code.
| Parameter | Type | Default | Description |
|---|---|---|---|
|
string |
utf8 |
Text encoding used |
|
string |
none |
A Python callable that impmlements a data source |
See also:
Rasterlite
| Parameter | Type | Default | Description |
|---|---|---|---|
|
string |
none |
name of a |
|
|||
|
3.2.3. Other data sources
The following data source plugins are not really part of the Mapnik project, even though some of them have their github repostitory under the mapnik project.
Hello World
The Hello World plugin is an example of the minimal code needed to implement an input plugin. It only ever returns a single point geometry located in the middle of the current map extent, with a single attribite named key and a constant value of hello world!.
GeoWave
Mongo
3.3. FileSource
A <FileSource> can be used as a child of <Map> to declare named directory paths
that then can be referred to as base attribute in for files to read by data sources file, like e.g. the CSV and GeoJSON ones,
and for symbolizers that are able to load image files, like e.g. <PointSymbolizer>, <LinePatternSymbolizer> etc.
| Attribute | Value | Default | Description |
|---|---|---|---|
|
string |
none |
The actual file to be processed in the example below will be taken from path/to/csv-data/file.csv:
<Map>
  <FileSource name='csv-base'>path/to/csv-data</FileSource>
  [...]
  <DataSource>
    <Parameter name="type">csv</Parameter>
    <Paramater name="base">csv-base</Parameter>
    <Parameter name="file">file.csv</Parameter>
  </DataSource>
  [...]
</Map>The actual symbol file being used in the example below will be taken from path/to/symbols/symbol.svg:
<Map>
  <FileSource name='symbols'>path/to/symbols</FileSource>
  [...]
  <PointSymbolizer base='symbols' file='symbol.svg'/>
  [...]
</Map>
3.4. Font
| Attribute | Value | Default | Description |
|---|---|---|---|
|
string |
none |
3.5. FontSet
A <FontSet> contains a list of or more <Font> entries that are searched in the listed order when rendering characters. This way a style sheet can specify multiple alternative fonts for different platforms, or different language specific fonts.
Listed fonts that are not found on the system runnng Mapnik are simply ignored after generating a warning. Also when a certain character is not found in the first font the other fonts are searched in order until one supporting the character is found.
|
Note
|
Note that by default Mapnik only looks for fonts under one pre-configured directory and it’s subdirectories, e.g. |
So when e.g. a map is to show both <TextSymbolizer> or <ShieldSymbolizer> using the fontset_name attribute.
| Attribute | Value | Default | Description |
|---|---|---|---|
|
string |
"<missing name>" |
  <FontSet name="my-fonts">
    <Font face-name="Noto Sans Regular"/>
    <Font face-name="Noto Sans CJK JP Regular"/>
  </FontSet>
3.6. Layer
A layer renders data from a data source using one or more styles.
| Attribute | Value | Default | Description |
|---|---|---|---|
|
float |
0 |
|
|
bool |
false |
On layers with multiple styles: read features from data source only once and cache them in memory. Improves perforance, but at the cost of using more memory, so off by default. |
|
bool |
false |
Clear the placement cache from previous layers, so that texts, points and markers may overlap with those from previous layers. |
|
string |
none |
On layers with multiple styles these styles are processed one by one in the given order by default. When giving a group-by property, feature elements will be sorted by this property, and styles will be processed in order for each distinct group value. E.g with |
|
float |
0 |
Minimum map scale above which this layer should be rendered. |
|
4x float |
Maximum exent for which features should be processed. |
|
|
float |
max. float |
Maximum map scale up to which this layer should be rendered. |
|
string |
none |
Name by which the layer can be refeenced, e.g. for error messaes. |
|
bool |
false |
unused? |
|
proj4 srs string |
|
Spatial reference system |
|
boolean |
true |
Whether this layer should actually be processed or not. Caution: when set to |
<Layer name="layer_1">
  <StyleName>style_1</StyleName>
  <StyleName>style_2</StyleName>

  <DataSource>
    [...]
  </DataSource>
</Layer>
3.7. Style
Styles contain a set of rendering rules to render data elements provided by a data source. Each style can contain one or more rules for rendering specific features.
| Attribute | Value | Default | Description |
|---|---|---|---|
|
SVG compositing |
||
|
"all", "first" |
"all" |
|
|
float |
1 |
|
|
boolean |
false |
|
|
string |
||
|
string |
3.8. Rule
A style rule filters data elements provided by a data source, and renders the matching elmements using one or more symbolizers. Rules can also be limited to specific scale factor ranges only, e.g. to implement different zoom level styles.
| Attribute | Value | Default | Description |
|---|---|---|---|
|
string |
none |
3.9. Filter
Filters specify on what data elements a rule should operate, by evaluating expressions. The expression language supports simple comparisons, logic, math, and regular expression matching.
There are also two special filters that do not evaluate expresions but depend on whether other previous filters in the style found a match:
<ElseFilter> matches if no other filter in a style matched so far, so it can be used as a fallback default.
<AlsoFilter> only matches if at least one previous filter in a style matched.
The <Filter> tag has no tag attributes.
3.9.1. Filter expressions
The filter expression language supports the following constants, operators, and functions. It also allows for referencing data element attributes by putting the attribute name in square brackets [attribute] and to change evaluation order by putting expression parts in regular round brackets (…).
TODO: operator precedence TODO: regular expression match and replace
Constants
true-
logical true
false-
logical false
pi-
3.14159…
deg_to_rad-
0.01745… (pi/180)
rad_to_deg-
57.295… (180/pi)
Operators
+-*/%and,&&or,||not,!=,eq,is!=,<>,neq<,lt<=,le>,gt>=,ge-
…
Functions
sin(x)-
Sinus
cos(x)-
Cosinus
tan(x)-
Tangens
atan(x)-
Arc Tangens
exp(x)-
ex log(x)-
natural logarithm of
x pow(x,y=-
xy abs(x)-
positive absolute value of
x min(x,y)-
minimum value
max(x,y)-
maximum value
length(str)-
string length
3.10. Symbolizers
Symbolizers do the actual rendering of map features. There are several different kinds of symbolizers that operate on point, line and polygon data objects to create visual representations on these. Below you will find detailed descriptions of the available symbolizers in alphabetical order.
|
Note
|
Right now all the symbolizer examples below show a complete XML style file. I’m considering to shorten these to just the actual symbolizer tag and the inline CSV data lines as the rest of these examples is actually redundant, to save some space, with hyperlinks to the actual full example files … |
3.10.1. PointSymbolizer
The point symbolizer draws a given image at a point position. When given a line or polygon as input the shape will be put at the middle of the line or center of the polygon.
If no image file is specified a small square is used as the default point image.
For putting symbols along a line or the edge of a polygon the MarkerSymbolizer is usually a better choice.
| Attribute | Type | Default | Description |
|---|---|---|---|
file path |
none |
||
string |
none |
name of a <FileSource> to find the input file in |
|
bool |
false |
allow to paint over previous symbolizers output |
|
float |
1.0 |
||
string |
cetroid |
Wehter to place on a polygons centroid, which can actually be outside, or its interior |
|
|
bool |
false |
|
SVG transform |
identity |
||
|
Compositing |
src-over |
file attribute
file refers to a SVG or PNG file to include as a symbol at the point position.
The file can be given as a constant string, or as an expression, so files to display can be dynamically chosen from layer data.
By default file paths are either absolute or relative to the directory the main style file is in, but different directory paths can be set up using the <FileSource> tag and referenced by its name using the base attribute.
<?xml version="1.0" encoding="utf-8"?>
<Map background-color="white">
  <FileSource name="symbols">./symbols</FileSource>

  <Style name="style">
    <Rule>
      <PointSymbolizer allow-overlap="true" base="symbols" file="[file]"/>
      <TextSymbolizer face-name="DejaVu Sans Book" allow-overlap="true" dy="20">[file]</TextSymbolizer>
    </Rule>
  </Style>

  <Layer name="layer">
    <StyleName>style</StyleName>
    <Datasource>
      <Parameter name="type">csv</Parameter>
      <Parameter name="inline">
wkt,file
"POINT(1 0)","dot.svg"
"POINT(2 0)","bug.svg"
      </Parameter>
    </Datasource>
  </Layer>

</Map>
opacity attribute
The opacity attribute defines how opaque or transparant a point symbol should be rendered. The value range is from 0.0 for completely transparent to 1.0 for completely opaque.
<?xml version="1.0" encoding="utf-8"?>
<Map background-color="white">
  <FileSource name="symbols">./symbols</FileSource>

  <Style name="style">
    <Rule>
      <PointSymbolizer base="symbols" file="dot.svg" opacity="[opacity]"/>
      <TextSymbolizer face-name="DejaVu Sans Book" allow-overlap="true" dy="20">[opacity]</TextSymbolizer>
    </Rule>
  </Style>

  <Layer name="layer">
    <StyleName>style</StyleName>
    <Datasource>
      <Parameter name="type">csv</Parameter>
      <Parameter name="inline">
opacity,wkt
0.0,"POINT(  0 0)"
0.1,"POINT( 1 0)"
0.2,"POINT( 2 0)"
0.3,"POINT( 3 0)"
0.4,"POINT( 4 0)"
0.5,"POINT( 5 0)"
0.6,"POINT( 6 0)"
0.7,"POINT( 7 0)"
0.8,"POINT( 8 0)"
0.9,"POINT( 9 0)"
1.0,"POINT(10 0)"
      </Parameter>
    </Datasource>
  </Layer>

</Map>
base attribute
The base attribute defines which <FileSource> should be used as the base directory for a file symbol.
|
Note
|
The base attribute only accepts constant strings, no expressions.
So it can only be chosen dynamically by using <Rule>/<Filter> constructs.
|
<?xml version="1.0" encoding="utf-8"?>
<Map background-color="white">
  <FileSource name="default">./symbols</FileSource>
  <FileSource name="red">./symbols/red</FileSource>
  <FileSource name="green">./symbols/green</FileSource>
  <FileSource name="blue">./symbols/blue</FileSource>

  <Style name="style">
    <Rule>
      <Filter>[base] = "red"</Filter>
      <PointSymbolizer allow-overlap="true" file="bug.svg" base="red"/>
    </Rule>
    <Rule>
      <Filter>[base] = "blue"</Filter>
      <PointSymbolizer allow-overlap="true" file="bug.svg" base="blue"/>
    </Rule>
    <Rule>
      <Filter>[base] = "green"</Filter>
      <PointSymbolizer allow-overlap="true" file="bug.svg" base="green"/>
    </Rule>
    <Rule>
      <AlsoFilter />
      <TextSymbolizer face-name="DejaVu Sans Book" allow-overlap="true" dy="20">[base]</TextSymbolizer>
    </Rule>
    <Rule>
      <ElseFilter />
      <PointSymbolizer allow-overlap="true" file="bug.svg" base="default"/>
      <TextSymbolizer face-name="DejaVu Sans Book" allow-overlap="true" dy="20" fill="red">"FileSource for base '"+[base]+"' not found"</TextSymbolizer>
    </Rule>
  </Style>

  <Layer name="layer">
    <StyleName>style</StyleName>
    <Datasource>
      <Parameter name="type">csv</Parameter>
      <Parameter name="inline">
wkt,base
"POINT(0 0)","red"
"POINT(1 0)","blue"
"POINT(2 0)","green"
"POINT(4 0)","foobar"
      </Parameter>
    </Datasource>
  </Layer>

</Map>
allow-overlap attribute
The allow-overlap defines whether a point symbolizer may be drawn over previous output.
<?xml version="1.0" encoding="utf-8"?>
<Map background-color="white">
  <FileSource name="symbols">./symbols</FileSource>

  <Style name="style">
    <Rule>
      <PolygonSymbolizer/>
      <TextSymbolizer face-name="DejaVu Sans Book">[caption]</TextSymbolizer>
      <PointSymbolizer allow-overlap="[allow-overlap]" base="symbols" opacity="0.3" file="bug.svg"/>
      <TextSymbolizer face-name="DejaVu Sans Book" allow-overlap="true" dy="20">[allow-overlap]</TextSymbolizer>
    </Rule>
  </Style>

  <Layer name="layer">
    <StyleName>style</StyleName>
    <Datasource>
      <Parameter name="type">csv</Parameter>
      <Parameter name="inline">
wkt,allow-overlap,caption
"POINT(0 0)",true,overlap
"POINT(1 0)",false,overlap
"POINT(3 0.2)",true,
"POINT(3.1 0)",true,
"POINT(4 0.2)",true,
"POINT(4.1 0)",false,
      </Parameter>
    </Datasource>
  </Layer>

</Map>
placement attribute
The placement attribute specifies where the point symbol should
be placed on a polygon object. By default it is placed on the centroid
of the polygons, but for a non-convex polygon this can actually place the symbol outside of the polygon itself. interior makes sure that the symbol is placed within the polygon in all cases.
<?xml version="1.0" encoding="utf-8"?>
<Map background-color="white">
  <FileSource name="symbols">./symbols</FileSource>

  <Style name="style">
    <Rule>
      <PolygonSymbolizer/>
      <PointSymbolizer allow-overlap="true" placement="[placement]" base="symbols" file="bug.svg"/>
      <TextSymbolizer face-name="DejaVu Sans Book" allow-overlap="true" dy="50">[placement]</TextSymbolizer>
    </Rule>
  </Style>

  <Layer name="layer">
    <StyleName>style</StyleName>
    <Datasource>
      <Parameter name="type">csv</Parameter>
      <Parameter name="inline">
wkt,placement
"POLYGON(( 1 1, 6 1, 6 5, 5 5, 5 2, 2 2, 2 5, 1 5, 1 1))",interior
"POLYGON((11 1,16 1,16 5,15 5,15 2,12 2,12 5,11 5,11 1))",centroid
      </Parameter>
    </Datasource>
  </Layer>

</Map>
transform attribute
TODO: document SVG transformations
<?xml version="1.0" encoding="utf-8"?>
<Map background-color="white">
  <FileSource name="symbols">./symbols</FileSource>

  <Style name="style">
    <Rule>
      <PointSymbolizer base="symbols" file="bug.svg" transform="scale([scale])"/>
      <TextSymbolizer face-name="DejaVu Sans Book" allow-overlap="true" dy="40">[scale]+"x"</TextSymbolizer>
    </Rule>
  </Style>

  <Layer name="layer">
    <StyleName>style</StyleName>
    <Datasource>
      <Parameter name="type">csv</Parameter>
      <Parameter name="inline">
scale,wkt
0.5,"POINT( 0 0)"
  1,"POINT( 1 0)"
  2,"POINT( 2 0)"
      </Parameter>
    </Datasource>
  </Layer>

</Map><?xml version="1.0" encoding="utf-8"?>
<Map background-color="white">
<FileSource name="symbols">./symbols</FileSource>
<Style name="style">
<Rule>
<PointSymbolizer base="symbols" file="bug.svg" transform="rotate([rotate])"/>
<TextSymbolizer face-name="DejaVu Sans Book" allow-overlap="true" dy="20">[rotate]+"°"</TextSymbolizer>
</Rule>
</Style>
<Layer name="layer">
<StyleName>style</StyleName>
<Datasource>
<Parameter name="type">csv</Parameter>
<Parameter name="inline">
rotate,wkt
0,"POINT( 0 0)"
45,"POINT( 1 0)"
90,"POINT( 2 0)"
180,"POINT( 3 0)"
270,"POINT( 4 0)"
</Parameter>
</Datasource>
</Layer>
</Map>comp-up attribute
TODO: document SVG compositing
TODO
3.10.2. MarkersSymbolizer
The MarkersSymbolizer is similar to the PointSymbolizer, but has two advantages when used on a line or polygon: it can be drawn multiple times along a line automatically, and it’s orientation is rotated according to the current direction of the line instead of always being upright.
| Attribute | Type | Default | Description |
|---|---|---|---|
file path |
none |
||
|
string |
none |
name of a <FileSource> to find the input file in |
float |
1.0 |
Marker opacity for both fill and stroke |
|
float |
1.0 |
Marker fill opacity |
|
float |
1.0 |
Marker stroke opacity (only for internal markers) |
|
float |
0.5 |
Marker stroke width (only for internal markers) |
|
|
string |
none |
One of builtin types "ellipse" or "arrow", deprecated, use |
string |
each |
Where to put marker on multi part polygons: each, whole, largest |
|
float |
10 |
Marker symbol width in pixels |
|
float |
10 |
Marker symbol height in pixels |
|
string |
point |
Marker placement strategy: one of point, line, interior, vertex-first, vertex-last |
Known Problems
TODO: incomplete
|
Warning
|
The internal marker URIs like https://github.com/mapnik/mapnik/issues/4183[(Mapnik issue #4183) |
See also:
MarkersSymbolizer Examples
<?xml version="1.0" encoding="utf-8"?>
<Map background-color="white">
  <FileSource name="symbols">./symbols</FileSource>

  <Style name="style">
    <Rule>
      <MarkersSymbolizer allow-overlap="true" base="symbols" file="[file]"/>
      <TextSymbolizer face-name="DejaVu Sans Book" allow-overlap="true" dy="20">[file]</TextSymbolizer>
    </Rule>
  </Style>

  <Layer name="layer">
    <StyleName>style</StyleName>
    <Datasource>
      <Parameter name="type">csv</Parameter>
      <Parameter name="inline">
wkt,file
"POINT(0 0)",""
"POINT(1 0)","dot.svg"
"POINT(2 0)","bug.svg"
      </Parameter>
    </Datasource>
  </Layer>

</Map><?xml version="1.0" encoding="utf-8"?>
<Map background-color="white">
<FileSource name="symbols">./symbols</FileSource>
<Style name="style">
<Rule>
<MarkersSymbolizer base="symbols" file="dot.svg" opacity="[opacity]"/>
<TextSymbolizer face-name="DejaVu Sans Book" allow-overlap="true" dy="20">[opacity]</TextSymbolizer>
</Rule>
</Style>
<Layer name="layer">
<StyleName>style</StyleName>
<Datasource>
<Parameter name="type">csv</Parameter>
<Parameter name="inline">
opacity,wkt
0.0,"POINT( 0 0)"
0.1,"POINT( 1 0)"
0.2,"POINT( 2 0)"
0.3,"POINT( 3 0)"
0.4,"POINT( 4 0)"
0.5,"POINT( 5 0)"
0.6,"POINT( 6 0)"
0.7,"POINT( 7 0)"
0.8,"POINT( 8 0)"
0.9,"POINT( 9 0)"
1.0,"POINT(10 0)"
</Parameter>
</Datasource>
</Layer>
</Map><?xml version="1.0" encoding="utf-8"?>
<Map background-color="white">
<Style name="style">
<Rule>
<MarkersSymbolizer file="shape://ellipse" fill-opacity="0" stroke-width="1" stroke="red" stroke-opacity="[opacity]"/>
<TextSymbolizer face-name="DejaVu Sans Book" allow-overlap="true" dy="20">[opacity]</TextSymbolizer>
</Rule>
</Style>
<Layer name="layer">
<StyleName>style</StyleName>
<Datasource>
<Parameter name="type">csv</Parameter>
<Parameter name="inline">
opacity,wkt
0.0,"POINT( 0 0)"
0.1,"POINT( 1 0)"
0.2,"POINT( 2 0)"
0.3,"POINT( 3 0)"
0.4,"POINT( 4 0)"
0.5,"POINT( 5 0)"
0.6,"POINT( 6 0)"
0.7,"POINT( 7 0)"
0.8,"POINT( 8 0)"
0.9,"POINT( 9 0)"
1.0,"POINT(10 0)"
</Parameter>
</Datasource>
</Layer>
</Map><?xml version="1.0" encoding="utf-8"?>
<Map background-color="white">
<FileSource name="symbols">./symbols</FileSource>
<Style name="style">
<Rule>
<MarkersSymbolizer base="symbols" file="dot.svg" opacity="[opacity]"/>
<TextSymbolizer face-name="DejaVu Sans Book" allow-overlap="true" dy="20">[opacity]</TextSymbolizer>
</Rule>
</Style>
<Layer name="layer">
<StyleName>style</StyleName>
<Datasource>
<Parameter name="type">csv</Parameter>
<Parameter name="inline">
opacity,wkt
0.0,"POINT( 0 0)"
0.1,"POINT( 1 0)"
0.2,"POINT( 2 0)"
0.3,"POINT( 3 0)"
0.4,"POINT( 4 0)"
0.5,"POINT( 5 0)"
0.6,"POINT( 6 0)"
0.7,"POINT( 7 0)"
0.8,"POINT( 8 0)"
0.9,"POINT( 9 0)"
1.0,"POINT(10 0)"
</Parameter>
</Datasource>
</Layer>
</Map><?xml version="1.0" encoding="utf-8"?>
<Map background-color="white">
<Style name="style">
<Rule>
<MarkersSymbolizer file="shape://arrow" fill="blue" stroke-width="1" stroke="red" fill-opacity="[opacity]"/>
<TextSymbolizer face-name="DejaVu Sans Book" allow-overlap="true" dy="20">[opacity]</TextSymbolizer>
</Rule>
</Style>
<Layer name="layer">
<StyleName>style</StyleName>
<Datasource>
<Parameter name="type">csv</Parameter>
<Parameter name="inline">
opacity,wkt
0.0,"POINT( 0 0)"
0.1,"POINT( 1 0)"
0.2,"POINT( 2 0)"
0.3,"POINT( 3 0)"
0.4,"POINT( 4 0)"
0.5,"POINT( 5 0)"
0.6,"POINT( 6 0)"
0.7,"POINT( 7 0)"
0.8,"POINT( 8 0)"
0.9,"POINT( 9 0)"
1.0,"POINT(10 0)"
</Parameter>
</Datasource>
</Layer>
</Map><?xml version="1.0" encoding="utf-8"?>
<Map background-color="white">
<FileSource name="symbols">./symbols</FileSource>
<Style name="style">
<Rule>
<LineSymbolizer stroke="black"/>
<MarkersSymbolizer allow-overlap="true" base="symbols" file="bug.svg" placement="[placement]" width="10" height="10" fill="red"/>
<TextSymbolizer face-name="DejaVu Sans Book" allow-overlap="true" dy="50">[placement]</TextSymbolizer>
</Rule>
</Style>
<Layer name="layer">
<StyleName>style</StyleName>
<Datasource>
<Parameter name="type">csv</Parameter>
<Parameter name="inline">
wkt,placement
"POLYGON(( 1 1, 6 1, 6 5, 5 5, 5 2, 2 2, 2 5, 1 5, 1 1))",point
"POLYGON((11 1, 16 1, 16 5, 15 5, 15 2, 12 2, 12 5, 11 5, 11 1))",interior
"POLYGON((21 1, 26 1, 26 5, 25 5, 25 2, 22 2, 22 5, 21 5, 21 1))",line
"LINESTRING(31 1, 36 1, 36 5, 35 5, 35 2, 32 2, 32 5)",vertex-first
"LINESTRING(41 1, 46 1, 46 5, 45 5, 45 2, 42 2, 42 5)",vertex-last
</Parameter>
</Datasource>
</Layer>
</Map><?xml version="1.0" encoding="utf-8"?>
<Map background-color="white">
<FileSource name="symbols">./symbols</FileSource>
<Style name="style">
<Rule>
<MarkersSymbolizer allow-overlap="true" base="symbols" file="bug.svg" width="[width]" height="[height]"/>
<TextSymbolizer face-name="DejaVu Sans Book" allow-overlap="true" dy="20">[width]</TextSymbolizer>
<TextSymbolizer face-name="DejaVu Sans Book" allow-overlap="true" dy="30">[height]</TextSymbolizer>
</Rule>
</Style>
<Layer name="layer">
<StyleName>style</StyleName>
<Datasource>
<Parameter name="type">csv</Parameter>
<Parameter name="inline">
wkt,width,height
"POINT(0 0)",32,32
"POINT(1 0)",16,32
"POINT(2 0)",32,16
</Parameter>
</Datasource>
</Layer>
</Map><?xml version="1.0" encoding="utf-8"?>
<Map background-color="white">
<Style name="style">
<Rule>
<PolygonSymbolizer fill="lightgray"/>
<LineSymbolizer stroke="black"/>
<MarkersSymbolizer allow-overlap="true" file="shape://ellipse" multi-policy="[placement]" width="10" height="10" fill="red"/>
</Rule>
</Style>
<Layer name="layer">
<StyleName>style</StyleName>
<Datasource>
<Parameter name="type">csv</Parameter>
<Parameter name="inline">
wkt,placement
"MULTIPOLYGON((( 30 20, 60 20, 60 70, 30 70, 30 20)),(( 90 10, 110 10, 110 30, 90 30, 90 10)),(( 90 50, 120 50, 120 80, 90 80, 90 50)))",each
"MULTIPOLYGON(((130 20,160 20,160 70,130 70,130 20)),((190 10, 210 10, 210 30,190 30,190 10)),((190 50, 220 50, 220 80,190 80,190 50)))",whole
"MULTIPOLYGON(((230 20,260 20,260 70,230 70,230 20)),((290 10, 310 10, 310 30,290 30,290 10)),((290 50, 320 50, 320 80,290 80,290 50)))",largest
</Parameter>
</Datasource>
</Layer>
<Style name="style2">
<Rule>
<LineSymbolizer stroke="blue" stroke-width="2"/>
<TextSymbolizer face-name="DejaVu Sans Book" allow-overlap="true" dy="60">[placement]</TextSymbolizer>
</Rule>
</Style>
<Layer name="layer2">
<StyleName>style2</StyleName>
<Datasource>
<Parameter name="type">csv</Parameter>
<Parameter name="inline">
wkt,placement
"POLYGON(( 27 5, 123 5, 123 85, 27 85, 27 15))",each
"POLYGON((127 5, 223 5, 223 85, 127 85, 127 15))",whole
"POLYGON((227 5, 323 5, 323 85, 227 85, 227 15))",largest
</Parameter>
</Datasource>
</Layer>
</Map>3.10.3. LineSymbolizer
The LineSymbolizer specifies how to render linear geometries like lines and polygon outlines. Most of the LineSymbolizer attributes define stroke attributes of the line to draw, like color, width, how line joins and ends should look, and even dash patterns.
There are also some attributes that change the lines geometry itself, like offset, smooth and simplify.
| Attribute | Value | Default | Description |
|---|---|---|---|
|
boolean |
false |
|
|
SVG compositing |
||
|
SVG transform |
||
float |
0 |
||
|
full, fast |
full |
|
0.0 - 1.0 |
1 |
||
|
float |
0 |
|
|
radial-distance, zhao-saalfeld, visvalingam-whyatt, douglas-peucker |
radial-distance |
|
color |
black |
||
number list |
none |
||
|
number list |
none |
experimental only |
|
0.0 - 1.0 |
1 |
|
|
power, linear, none, threshold, multiply |
power |
|
bevel, miter, miter-revert, round |
miter |
||
butt, round, square |
butt |
||
float |
4 |
||
0.0 - 1.0 |
1 |
||
float |
1 |
TODO: * for miterlimit see e.g. https://developer.mozilla.org/en-US/docs/Web/SVG/Attribute/stroke-miterlimit for meterlimit description / visualization * for simplify-algorithm see e.g. https://i11www.iti.kit.edu/_media/teaching/sommer2013/algokartografie/gruppe1.pdf
<?xml version="1.0" encoding="utf-8"?>
<Map background-color='white'>

  <Style name="style">
    <Rule>
      <LineSymbolizer smooth="[smooth]"/>
      <TextSymbolizer face-name="DejaVu Sans Book" allow-overlap="true" dy="20">[smooth]</TextSymbolizer>
    </Rule>
  </Style>

  <Layer name="layer">
    <StyleName>style</StyleName>
    <Datasource>
      <Parameter name="type">csv</Parameter>
      <Parameter name="inline">
wkt,smooth
"LINESTRING(10 10,50 20,90 10)",0.0
"LINESTRING(10 20,50 30,90 20)",0.5
"LINESTRING(10 30,50 40,90 30)",1.0
      </Parameter>
    </Datasource>
  </Layer>

</Map><?xml version="1.0" encoding="utf-8"?>
<Map background-color='white'>
<Style name="style">
<Rule>
<LineSymbolizer stroke="[stroke]" stroke-width="5"/>
<TextSymbolizer face-name="DejaVu Sans Book" allow-overlap="true" dy="20">[stroke]</TextSymbolizer>
</Rule>
</Style>
<Layer name="layer">
<StyleName>style</StyleName>
<Datasource>
<Parameter name="type">csv</Parameter>
<Parameter name="inline">
wkt,stroke
"LINESTRING(10 10,50 20,90 10)",red
"LINESTRING(10 20,50 30,90 20)",green
"LINESTRING(10 30,50 40,90 30)",blue
</Parameter>
</Datasource>
</Layer>
</Map><?xml version="1.0" encoding="utf-8"?>
<Map background-color='white'>
<Style name="style">
<Rule>
<LineSymbolizer stroke-dasharray="[dash]" stroke-width="5"/>
<TextSymbolizer face-name="DejaVu Sans Book" allow-overlap="true" dy="20">[dash]</TextSymbolizer>
</Rule>
</Style>
<Layer name="layer">
<StyleName>style</StyleName>
<Datasource>
<Parameter name="type">csv</Parameter>
<Parameter name="inline">
wkt,dash
"LINESTRING(10 10,50 20,90 10)","5,5"
"LINESTRING(10 20,50 30,90 20)","10,5"
"LINESTRING(10 30,50 40,90 30)","10,5,2,5"
</Parameter>
</Datasource>
</Layer>
</Map>TODO: prevent image clipping on top edge
<?xml version="1.0" encoding="utf-8"?>
<Map background-color='white'>

  <Style name="style">
    <Rule>
      <LineSymbolizer stroke="#7F7F7F" stroke-linejoin="[join]" stroke-width="20"/>
      <LineSymbolizer stroke="#FF0000" stroke-width="1"/>
      <TextSymbolizer face-name="DejaVu Sans Book" allow-overlap="true" dy="30">[join]</TextSymbolizer>
    </Rule>
  </Style>

  <Layer name="layer">
    <StyleName>style</StyleName>
    <Datasource>
      <Parameter name="type">csv</Parameter>
      <Parameter name="inline">
wkt,join
"LINESTRING(30 30,50 50,70 30)",bevel
"LINESTRING(30 20,50 40,70 20)",round
"LINESTRING(30 10,50 30,70 10)",miter
      </Parameter>
    </Datasource>
  </Layer>

</Map><?xml version="1.0" encoding="utf-8"?>
<Map background-color='white'>
<Style name="style">
<Rule>
<LineSymbolizer stroke="#7F7F7F" stroke-linecap="[cap]" stroke-width="20"/>
<LineSymbolizer stroke="#FF0000" stroke-width="1"/>
<TextSymbolizer face-name="DejaVu Sans Book" allow-overlap="true" dy="20">[cap]</TextSymbolizer>
</Rule>
</Style>
<Layer name="layer">
<StyleName>style</StyleName>
<Datasource>
<Parameter name="type">csv</Parameter>
<Parameter name="inline">
wkt,cap
"LINESTRING(0 6,20 6)",but
"LINESTRING(0 3,20 3)",round
"LINESTRING(0 0,20 0)",square
</Parameter>
</Datasource>
</Layer>
</Map><?xml version="1.0" encoding="utf-8"?>
<!-- TODO: caption text -->
<Map background-color='white'>
<Style name="style">
<Rule>
<LineSymbolizer stroke-linejoin="miter" stroke-width="10" stroke-miterlimit="[ml]" stroke="#7f7f7f"/>
<LineSymbolizer stroke-width="1" stroke="#FF0000"/>
<!-- <TextSymbolizer face-name="DejaVu Sans Book" allow-overlap="true" dy="20">[cap]</TextSymbolizer> -->
</Rule>
</Style>
<Layer name="layer">
<StyleName>style</StyleName>
<Datasource>
<Parameter name="type">csv</Parameter>
<Parameter name="inline">
wkt,ml
"LINESTRING(10 10,20 30,30 10)",2
"LINESTRING(14 10,20 25,26 10)",2
"LINESTRING(18 10,20 18,22 10)",2
"LINESTRING(40 10,50 30,60 10)",2.5
"LINESTRING(44 10,50 25,56 10)",2.5
"LINESTRING(48 10,50 18,52 10)",2.5
"LINESTRING(70 10,80 30,90 10)",6
"LINESTRING(74 10,80 25,86 10)",6
"LINESTRING(78 10,80 18,82 10)",6
</Parameter>
</Datasource>
</Layer>
</Map><?xml version="1.0" encoding="utf-8"?>
<Map background-color='white'>
<Style name="style">
<Rule>
<LineSymbolizer stroke-opacity="[opacity]" stroke-width="5"/>
<TextSymbolizer face-name="DejaVu Sans Book" allow-overlap="true" dy="20">[opacity]</TextSymbolizer>
</Rule>
</Style>
<Layer name="layer">
<StyleName>style</StyleName>
<Datasource>
<Parameter name="type">csv</Parameter>
<Parameter name="inline">
wkt,opacity
"LINESTRING(10 10,50 20,90 10)",0.2
"LINESTRING(10 20,50 30,90 20)",0.5
"LINESTRING(10 30,50 40,90 30)",0.8
</Parameter>
</Datasource>
</Layer>
</Map><?xml version="1.0" encoding="utf-8"?>
<Map background-color='white'>
<Style name="style">
<Rule>
<LineSymbolizer stroke-width="[width]"/>
<TextSymbolizer face-name="DejaVu Sans Book" allow-overlap="true" dy="20">[width]</TextSymbolizer>
</Rule>
</Style>
<Layer name="layer">
<StyleName>style</StyleName>
<Datasource>
<Parameter name="type">csv</Parameter>
<Parameter name="inline">
wkt,width
"LINESTRING(10 10,50 20,90 10)",1
"LINESTRING(10 20,50 30,90 20)",5
"LINESTRING(10 30,50 40,90 30)",10
</Parameter>
</Datasource>
</Layer>
</Map>Note that unlike in other LineSymbolizer examples this is three times the same geometry, but with different offset.
<?xml version="1.0" encoding="utf-8"?>
<Map background-color='white'>

  <Style name="style">
    <Rule>
      <LineSymbolizer offset="[offset]"/>
      <TextSymbolizer face-name="DejaVu Sans Book" allow-overlap="true" dy="[offset]+10">[offset]</TextSymbolizer>
    </Rule>
  </Style>

  <Layer name="layer">
    <StyleName>style</StyleName>
    <Datasource>
      <Parameter name="type">csv</Parameter>
      <Parameter name="inline">
wkt,offset
"LINESTRING(10 10,50 20,90 10)",20
"LINESTRING(10 10,50 20,90 10)",0
"LINESTRING(10 10,50 20,90 10)",-20
      </Parameter>
    </Datasource>
  </Layer>

</Map>
See also:
TODO: gamma, gamma-method, dash-offset, miter-limit, clip, simplify, simplify-algorithm, rasterize, geometry-transform, comp-op
3.10.4. LinePatternSymbolizer
A LinePatternSymbolizer draws a given pattern image along a line, repeating the pattern as often as needed, and transforming it accordingly to follow the turns of the line.
|
Warning
|
Even when giving the pattern as a SVG file, internally it will be converted to PNG before applying transformations to it to make it fit the line. So when creating SVG or PDF output, the result can still become a bit blurry when zooming in on LinePatternSymbolizer output. |
| Attribute | Value | Default | Description |
|---|---|---|---|
file path |
none |
Path to pattern file |
|
|
string |
none |
name of a <FileSource> to find the input file in |
|
|||
|
|||
|
|||
<?xml version="1.0" encoding="utf-8"?>
<Map background-color='white'>
  <FileSource name="symbols">./symbols</FileSource>

  <Style name="style">
    <Rule>
       <LinePatternSymbolizer base="symbols" file="[file]"/>
       <TextSymbolizer face-name="DejaVu Sans Book" allow-overlap="true" dx="-50">[file]</TextSymbolizer>
    </Rule>
  </Style>

  <Layer name="layer">
    <StyleName>style</StyleName>
    <Datasource>
      <Parameter name="type">csv</Parameter>
      <Parameter name="inline">
wkt,file
"LINESTRING(10 50,50 60,90 50)",cliff.svg
"LINESTRING(10 30,50 40,90 30)",line-with-dot.svg
"LINESTRING(10 10,50 20,90 10)",steps.svg
      </Parameter>
    </Datasource>
  </Layer>

</Map>
<?xml version="1.0" encoding="utf-8"?>
<Map background-color='white'>
  <FileSource name="symbols">./symbols</FileSource>
  <FileSource name="red">./symbols/red</FileSource>
  <FileSource name="green">./symbols/green</FileSource>
  <FileSource name="blue">./symbols/blue</FileSource>

  <Style name="style">
    <Rule>
      <LinePatternSymbolizer base="red" file='steps.svg'/> <!-- TODO does not evaluate [base] yet -->
      <PointSymbolizer base="symbols" file='steps.svg' transform='translate(0,5)'/>
      <TextSymbolizer face-name="DejaVu Sans Book" allow-overlap="true" dy="20">[base]</TextSymbolizer>
    </Rule>
  </Style>

  <Layer name="layer">
    <StyleName>style</StyleName>
    <Datasource>
      <Parameter name="type">csv</Parameter>
      <Parameter name="inline">
wkt,base
"LINESTRING(10 10,50 20,90 10)",red
"LINESTRING(10 20,50 30,90 20)",green
"LINESTRING(10 30,50 40,90 30)",blue
      </Parameter>
    </Datasource>
  </Layer>

</Map>
3.10.5. PolygonSymbolizer
| Attribute | Value | Default | Description |
|---|---|---|---|
color |
grey |
||
float |
1.0 |
||
|
SVG transformation |
none |
|
|
SVG composition |
none |
|
|
float |
1.0 |
|
|
power, linear, none, threshold, multiply |
power |
|
|
boolean |
false |
|
|
float |
0.0 |
|
|
radial-distance, zhao-saalfeld, visvalingam-whyatt, douglas-peucker |
radial-distance |
|
float |
0.0 |
<?xml version="1.0" encoding="utf-8"?>
<Map background-color="white">

  <Style name="style">
    <Rule>
      <PolygonSymbolizer fill="[fill]"/>
      <TextSymbolizer face-name="DejaVu Sans Book" allow-overlap="true" dy="50">[fill]</TextSymbolizer>
    </Rule>
  </Style>

  <Layer name="layer">
    <StyleName>style</StyleName>
    <Datasource>
      <Parameter name="type">csv</Parameter>
      <Parameter name="inline">
wkt,fill
"POLYGON(( 2 1, 1 3, 3 4, 5 3, 4 1, 2 1))",red
"POLYGON((12 1,11 3,13 4,15 3,14 1,12 1))",green
"POLYGON((22 1,21 3,23 4,25 3,24 1,22 1))",blue
      </Parameter>
    </Datasource>
  </Layer>

</Map><?xml version="1.0" encoding="utf-8"?>
<Map background-color="white">
<Style name="style">
<Rule>
<PolygonSymbolizer fill="black" fill-opacity="[opacity]"/>
<TextSymbolizer face-name="DejaVu Sans Book" allow-overlap="true" dy="50">[opacity]</TextSymbolizer>
</Rule>
</Style>
<Layer name="layer">
<StyleName>style</StyleName>
<Datasource>
<Parameter name="type">csv</Parameter>
<Parameter name="inline">
wkt,opacity
"POLYGON(( 2 1, 1 3, 3 4, 5 3, 4 1, 2 1))",0.2
"POLYGON((12 1,11 3,13 4,15 3,14 1,12 1))",0.5
"POLYGON((22 1,21 3,23 4,25 3,24 1,22 1))",0.8
</Parameter>
</Datasource>
</Layer>
</Map><?xml version="1.0" encoding="utf-8"?>
<Map background-color="white">
<Style name="style">
<Rule>
<PolygonSymbolizer smooth="[smooth]"/>
<TextSymbolizer face-name="DejaVu Sans Book" allow-overlap="true" dy="50">[smooth]</TextSymbolizer>
</Rule>
</Style>
<Layer name="layer">
<StyleName>style</StyleName>
<Datasource>
<Parameter name="type">csv</Parameter>
<Parameter name="inline">
wkt,smooth
"POLYGON(( 2 1, 1 3, 3 4, 5 3, 4 1, 2 1))",0.0
"POLYGON((12 1,11 3,13 4,15 3,14 1,12 1))",0.5
"POLYGON((22 1,21 3,23 4,25 3,24 1,22 1))",1.0
</Parameter>
</Datasource>
</Layer>
</Map>3.10.6. PolygonPatternSymbolizer
| Attribute | Value | Default | Description |
|---|---|---|---|
|
file path |
none |
|
|
string |
none |
name of a <FileSource> to find the input file in |
|
|
|
Align image to polygon ( |
|
float |
1.0 |
|
|
|||
|
float |
1.0 |
Filling opacity. May be somewhat transparent even at 1.0 if the fill pattern itself is not fully opaque. |
|
|||
|
|||
|
|||
|
float |
0.0 |
|
|
SVG Transform |
none |
Transformation is applied to the fill pattern |
|
SVG Transform |
none |
Transformation is applied to the polygon geometry itself |
|
SVG compositingg |
none |
<?xml version="1.0" encoding="utf-8"?>
<Map background-color="white">
  <FileSource name="symbols">./symbols/</FileSource>

  <Style name="style">
    <Rule>
      <PolygonPatternSymbolizer base="symbols" file="[file]"/>
      <TextSymbolizer face-name="DejaVu Sans Book" allow-overlap="true" dy="50">[file]</TextSymbolizer>
    </Rule>
  </Style>

  <Layer name="layer">
    <StyleName>style</StyleName>
    <Datasource>
      <Parameter name="type">csv</Parameter>
      <Parameter name="inline">
wkt,file
"POLYGON(( 2 1, 1 3, 3 4, 5 3, 4 1, 2 1))",dot.svg
"POLYGON((12 1,11 3,13 4,15 3,14 1,12 1))",steps.svg
"POLYGON((22 1,21 3,23 4,25 3,24 1,22 1))",bug.svg
      </Parameter>
    </Datasource>
  </Layer>

</Map>
global alignment makes the fill pattern align across touching polygon borders, local alignment makes each filled polygon of the same shape look exactly the same.
<?xml version="1.0" encoding="utf-8"?>
<Map background-color="white">
  <FileSource name="symbols">./symbols/</FileSource>

  <Style name="style">
    <Rule>
       <PolygonPatternSymbolizer base="symbols" file="checker-board.svg" alignment="[align]"/>
       <LineSymbolizer stroke="black"/>
      <TextSymbolizer face-name="DejaVu Sans Book" allow-overlap="false" dx="30" dy="30">[align]</TextSymbolizer>
    </Rule>
  </Style>

  <Layer name="layer">
    <StyleName>style</StyleName>
    <Datasource>
      <Parameter name="type">csv</Parameter>
      <Parameter name="inline">
wkt,align
"POLYGON(( 0 2, 1 3, 3 1, 2 0, 0 2))",global
"POLYGON(( 1 3, 2 4, 4 2, 3 1, 1 3))",global
"POLYGON(( 2 4, 3 5, 5 3, 4 2, 2 4))",global
"POLYGON((10 2,11 3,13 1,12 0,10 2))",local
"POLYGON((11 3,12 4,14 2,13 1,11 3))",local
"POLYGON((12 4,13 5,15 3,14 2,12 4))",local
      </Parameter>
    </Datasource>
  </Layer>

</Map>
<?xml version="1.0" encoding="utf-8"?>
<Map background-color="white">
  <FileSource name="symbols">./symbols/</FileSource>

  <Style name="style">
    <Rule>
      <PolygonPatternSymbolizer base="symbols" file="steps.svg" transform="rotate([rotate])"/>
      <TextSymbolizer face-name="DejaVu Sans Book" allow-overlap="true" dy="50">[rotate]</TextSymbolizer>
    </Rule>
  </Style>

  <Layer name="layer">
    <StyleName>style</StyleName>
    <Datasource>
      <Parameter name="type">csv</Parameter>
      <Parameter name="inline">
wkt,rotate
"POLYGON(( 2 1, 1 3, 3 4, 5 3, 4 1, 2 1))",0
"POLYGON((12 1,11 3,13 4,15 3,14 1,12 1))",45
"POLYGON((22 1,21 3,23 4,25 3,24 1,22 1))",90
      </Parameter>
    </Datasource>
  </Layer>

</Map>
Unlike wiht PointSymbolizer rotate() does not seem to rotate around the geometry center, but around the map origin at (0 0) instead?
<?xml version="1.0" encoding="utf-8"?>
<Map background-color="white">
  <FileSource name="symbols">./symbols/</FileSource>

  <Style name="style">
    <Rule>
      <PolygonPatternSymbolizer base="symbols" file="steps.svg" geometry-transform="rotate([rotate])"/>
      <TextSymbolizer face-name="DejaVu Sans Book" allow-overlap="true" dy="50">[rotate]</TextSymbolizer>
    </Rule>
  </Style>

  <Layer name="layer">
    <StyleName>style</StyleName>
    <Datasource>
      <Parameter name="type">csv</Parameter>
      <Parameter name="inline">
wkt,rotate
"POLYGON(( 2 1, 1 3, 3 4, 5 3, 4 1, 2 1))",0
"POLYGON((12 1,11 3,13 4,15 3,14 1,12 1))",5
"POLYGON((22 1,21 3,23 4,25 3,24 1,22 1))",10
      </Parameter>
    </Datasource>
  </Layer>

</Map>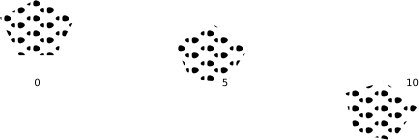
TODO: gamma, gamma-method, clip, simplify, simplify-method, comp-op
3.10.7. RasterSymbolizer
TODO
3.10.8. TextSymbolizer
| Attribute | Type | Default | Description |
|---|---|---|---|
Text attributes |
|||
|
string |
none |
Face name to use |
|
string |
none |
FontSet name |
float |
10.0 |
Font size in pixels |
|
color |
black |
Text fill color |
|
float |
0.0 |
Additional space between characters in pixels |
|
float |
1.0 |
Text opacity |
|
Wrap attributes |
|||
float |
0.0 |
Extra vertical space for multi line output in pixels |
|
|
string |
none |
Comma separated list of OpenType typographic features |
|
integer |
none |
Try to wrap text if it gets longer than this many pixels |
|
boolean |
false |
Wrap before or after reaching wrap-width |
|
boolean |
false |
Keep wrap character and repeat it on new line |
|
string |
none |
Break text at this character only instead of using general unicode line break algorithm |
Halo attributes |
|||
color |
white |
Text halo color |
|
float |
1.0 |
Text halo opacity |
|
float |
0.0 |
Text halo radius in pixels |
|
|
full, fast |
full |
Text halo rasterizing algorithm when using Agg renderer |
|
string |
src-over |
Compositing operator to use for the halo |
Placement attributes |
|||
|
bool |
false |
Allow text to overlap with other text or markers |
integer |
0 |
Spacing between text labels on lines if > 0 (in pixels?) |
|
string |
point |
One of |
|
float |
none |
Horizontal spacing between grid cells when using |
|
float |
none |
Vertical spacing between grid cells when using |
|
|
string |
dummy |
Algorithm to use to avoid text overlaps, one of |
|
string |
none |
If "placement-type" is set to "simple", use this "POSITIONS,[SIZES]" string. An example is text-placements: "E,NE,SE,W,NW,SW" (TODO: better explanation) |
|
float |
spacing/2 |
Allow displacement by this many pixel with placement=line |
|
float |
22.5 |
Max. angle change between adjacent characters in degrees, to avoid placing text around sharp corners |
|
boolean |
false |
Avoid placing text near image edges |
|
float |
none |
Minimum distance from other text, shields or markers |
|
float |
none |
Minimum distance from other labels with same text content across geometries |
|
float |
none |
Minimum placement distance from image edges |
float |
none |
Minimum length of lines or polygon boundings to place text on |
|
|
boolean |
false |
Force an odd number of labels to be generated |
|
2xfloat |
(0.0,0.0) |
Displace label by this many pixel horizontally/vertically |
|
float |
? |
?TODO? |
|
bool |
? |
?TODO? |
|
string |
? |
?TODO? one of auto, auto-down, left, left-only, right, right-only, up, down |
<?xml version="1.0" encoding="utf-8"?>
<Map background-color="white">

  <Style name="style">
    <Rule>
      <TextSymbolizer face-name="DejaVu Sans Book" size="[size]">"size "+[size]</TextSymbolizer>
    </Rule>
  </Style>

  <Layer name="layer">
    <StyleName>style</StyleName>
    <Datasource>
      <Parameter name="type">csv</Parameter>
      <Parameter name="inline">
wkt,size
"POINT(0 0)",8
"POINT(1 0)",10
"POINT(2 0)",12
"POINT(3 0)",16
      </Parameter>
    </Datasource>
  </Layer>

</Map><?xml version="1.0" encoding="utf-8"?>
<Map background-color="white">
<Style name="style">
<Rule>
<TextSymbolizer face-name="DejaVu Sans Book" size="12" fill="[fill]">[fill]</TextSymbolizer>
</Rule>
</Style>
<Layer name="layer">
<StyleName>style</StyleName>
<Datasource>
<Parameter name="type">csv</Parameter>
<Parameter name="inline">
wkt,fill
"POINT(0 0)",black
"POINT(1 0)",red
"POINT(2 0)",green
"POINT(3 0)",blue
</Parameter>
</Datasource>
</Layer>
</Map><?xml version="1.0" encoding="utf-8"?>
<Map background-color="white">
<Style name="style">
<Rule>
<TextSymbolizer face-name="DejaVu Sans Bold" size="24" fill="black" opacity="[opacity]">[opacity]</TextSymbolizer>
</Rule>
</Style>
<Layer name="layer">
<StyleName>style</StyleName>
<Datasource>
<Parameter name="type">csv</Parameter>
<Parameter name="inline">
wkt,opacity
"POINT(0 0)",1.0
"POINT(1 0)",0.75
"POINT(2 0)",0.5
"POINT(3 0)",0.25
</Parameter>
</Datasource>
</Layer>
</Map><?xml version="1.0" encoding="utf-8"?>
<Map background-color="white">
<Style name="style">
<Rule>
<TextSymbolizer face-name="DejaVu Sans Book" character-spacing="[spaceing]">"spacing "+[spaceing]</TextSymbolizer>
</Rule>
</Style>
<Layer name="layer">
<StyleName>style</StyleName>
<Datasource>
<Parameter name="type">csv</Parameter>
<Parameter name="inline">
wkt,spaceing
"POINT(0 0)",0
"POINT(1 0)",1
"POINT(2 0)",2
"POINT(3 0)",3
</Parameter>
</Datasource>
</Layer>
</Map><?xml version="1.0" encoding="utf-8"?>
<Map background-color="white">
<Style name="style">
<Rule>
<TextSymbolizer face-name="DejaVu Sans Book" line-spacing="[spaceing]" wrap-width="10">"line spaceing "+[spaceing]</TextSymbolizer>
</Rule>
</Style>
<Layer name="layer">
<StyleName>style</StyleName>
<Datasource>
<Parameter name="type">csv</Parameter>
<Parameter name="inline">
wkt,spaceing
"POINT(0 0)",0
"POINT(1 0)",5
"POINT(2 0)",10
"POINT(3 0)",15
</Parameter>
</Datasource>
</Layer>
</Map><?xml version="1.0" encoding="utf-8"?>
<Map background-color='white'>
<Style name="style">
<Rule>
<LineSymbolizer stroke="lightblue" stroke-width="5"/>
<TextSymbolizer spacing="[spacing]" face-name="DejaVu Sans Book" placement="line">[spacing]</TextSymbolizer>
</Rule>
</Style>
<Layer name="layer">
<StyleName>style</StyleName>
<Datasource>
<Parameter name="type">csv</Parameter>
<Parameter name="inline">
wkt,spacing
"LINESTRING(10 10,50 20,90 10)",30
"LINESTRING(10 20,50 30,90 20)",60
"LINESTRING(10 30,50 40,90 30)",90
</Parameter>
</Datasource>
</Layer>
</Map>placement Controls where the text is actually placed:
point-
Places the text just once at the center of the geometry. In case of a polygon that may actually be outside of the polygon surface, depending on its shape
interior-
Similar to
point, but makes sure that the text is placed inside a polygon even if its center point is actually on its outside line-
When
spacingis larger than zero the text is repeatedly printed along a line or a polygons outline withspacingpixels between texts vertex-
Tries to place the text on each vertex point of a line or a polygons outline
grid-
When
grid-cell-widthandgrid-cell-heightare greater than zero the text is repeatedly printed into a polygons surface, using grid cells of the given width and height. Note that the text is not clipped at the border of the polygon, so some text may be printed slightly outside of the polygon surface. alternating-grid-
Similar to
grid, but each second row is horizontally displaced by half ofgrid-cell-width
<?xml version="1.0" encoding="utf-8"?>
<Map background-color="white">

  <Style name="style">
    <Rule>
      <LineSymbolizer stroke="lightblue" stroke-width="5"/>
      <TextSymbolizer face-name="DejaVu Sans Book" placement="[placement]" grid-cell-width="30" grid-cell-height="20" spacing="30">A1</TextSymbolizer>
      <TextSymbolizer face-name="DejaVu Sans Book" allow-overlap="true" dy="50">[placement]</TextSymbolizer>
    </Rule>
  </Style>

  <Layer name="layer">
    <StyleName>style</StyleName>
    <Datasource>
      <Parameter name="type">csv</Parameter>
      <Parameter name="inline">
wkt,placement
"POLYGON(( 1 1, 6 1, 6 5, 5 5, 5 2, 2 2, 2 5, 1 5, 1 1))",interior
"POLYGON((11 1,16 1,16 5,                    11 5,11 1))",line
"POLYGON((21 1,26 1,26 5,                    21 5,21 1))",alternating-grid
"POLYGON(( 1 11, 6 11, 6 15, 5 15, 5 12, 2 12, 2 15, 1 15, 1 11))",point
"POLYGON((11 11,16 11,16 15,                        11 15,11 11))",vertex
"POLYGON((21 11,26 11,26 15,                        21 15,21 11))",grid
      </Parameter>
    </Datasource>
  </Layer>

</Map><?xml version="1.0" encoding="utf-8"?>
<Map background-color="white">
<Style name="style">
<Rule>
<LineSymbolizer stroke="lightblue" stroke-width="5"/>
<TextSymbolizer face-name="DejaVu Sans Book" placement="[placement]" grid-cell-width="[width]" grid-cell-height="[height]" spacing="30">A1</TextSymbolizer>
<TextSymbolizer face-name="DejaVu Sans Book" allow-overlap="true" dy="50">[width]+","+[height]+","+[placement]</TextSymbolizer>
</Rule>
</Style>
<Layer name="layer">
<StyleName>style</StyleName>
<Datasource>
<Parameter name="type">csv</Parameter>
<Parameter name="inline">
wkt,width,height,placement
"POLYGON(( 1 1, 6 1, 6 5, 1 5, 1 1))",30,20,alternating-grid
"POLYGON((11 1,16 1,16 5,11 5,11 1))",40,20,alternating-grid
"POLYGON((21 1,26 1,26 5,21 5,21 1))",40,30,alternating-grid
"POLYGON(( 1 11, 6 11, 6 15, 1 15, 1 11))",30,20,grid
"POLYGON((11 11,16 11,16 15,11 15,11 11))",40,20,grid
"POLYGON((21 11,26 11,26 15,21 15,21 11))",40,30,grid
</Parameter>
</Datasource>
</Layer>
</Map><?xml version="1.0" encoding="utf-8"?>
<Map background-color='white'>
<Style name="style">
<Rule>
<LineSymbolizer stroke="lightblue" stroke-width="5"/>
<TextSymbolizer minimum-path-length="200" face-name="DejaVu Sans Book" placement="line">A1</TextSymbolizer>
</Rule>
</Style>
<Layer name="layer">
<StyleName>style</StyleName>
<Datasource>
<Parameter name="type">csv</Parameter>
<Parameter name="inline">
wkt
"LINESTRING(10 10,20 10)"
"LINESTRING(10 20,30 20)"
"LINESTRING(10 30,40 30)"
</Parameter>
</Datasource>
</Layer>
</Map><?xml version="1.0" encoding="utf-8"?>
<Map background-color="white">
<Style name="style">
<Rule>
<TextSymbolizer face-name="DejaVu Sans Bold" size="24" fill="black" halo-fill="[fill]" halo-radius="1">[fill]</TextSymbolizer>
</Rule>
</Style>
<Layer name="layer">
<StyleName>style</StyleName>
<Datasource>
<Parameter name="type">csv</Parameter>
<Parameter name="inline">
wkt,fill
"POINT(0 0)",gray
"POINT(1 0)",red
"POINT(2 0)",green
"POINT(3 0)",blue
</Parameter>
</Datasource>
</Layer>
</Map><?xml version="1.0" encoding="utf-8"?>
<Map background-color="white">
<Style name="style">
<Rule>
<TextSymbolizer face-name="DejaVu Sans Bold" size="24" fill="black" halo-fill="red" halo-radius="[radius]">[radius]</TextSymbolizer>
</Rule>
</Style>
<Layer name="layer">
<StyleName>style</StyleName>
<Datasource>
<Parameter name="type">csv</Parameter>
<Parameter name="inline">
wkt,radius
"POINT(0 0)",1
"POINT(1 0)",2
"POINT(2 0)",3
"POINT(3 0)",4
</Parameter>
</Datasource>
</Layer>
</Map><?xml version="1.0" encoding="utf-8"?>
<Map background-color="white">
<Style name="style">
<Rule>
<TextSymbolizer face-name="DejaVu Sans Bold" size="24" fill="black" halo-fill="red" halo-radius="2" halo-opacity="[opacity]">[opacity]</TextSymbolizer>
</Rule>
</Style>
<Layer name="layer">
<StyleName>style</StyleName>
<Datasource>
<Parameter name="type">csv</Parameter>
<Parameter name="inline">
wkt,opacity
"POINT(0 0)",1.0
"POINT(1 0)",0.75
"POINT(2 0)",0.5
"POINT(3 0)",0.25
</Parameter>
</Datasource>
</Layer>
</Map>3.10.9. ShieldSymbolizer
A shield symbolizer is basically a combination of a point and a text symbolizer, making sure that both image and text are always shown at the same position, and that collision rules apply to both together instead of individually. The name stems from the original use case to show highway shields.
ShieldSymbolizer inherits almost all attributes from the TextSymbolizer, with a small number of additions and modifications.
| Attribute | Type | Default | Description |
|---|---|---|---|
|
file path |
none |
Shield image to use |
|
string |
none |
name of a <FileSource> to find the input file in |
|
float |
1.0 |
Opacity to use for the shield image |
|
float |
1.0 |
Opacity to use for the shield text |
|
boolean |
false |
|
|
float |
0.0 |
Move text, and image if |
|
float |
0.0 |
Move text, and image if |
|
float |
0.0 |
Move image horizontally only |
|
float |
0.0 |
Move image vertically only |
|
SVG transformation |
none |
Transform image |
/* name file face-name unlock-image size fill placement avoid-edges allow-overlap margin repeat-distance min-distance spacing min-padding label-position-tolerance wrap-width wrap-before wrap-character halo-fill halo-radius halo-rasterizer halo-transform halo-comp-op halo-opacity character-spacing line-spacing text-dx text-dy dx dy opacity horizontal-alignment vertical-alignment placement-type text-transform justify-alignment transform clip simplify simplify-algorithm smooth comp-op grid-cell-width grid-cell-height offset */
spacing controls the distance between shields on a single line feature. When no spacing is given only a single shield will be attemted to be placed.
See also repeat-distance, which controls how far shields with the same text should be set apart in general, even when placed on different geometries.
<?xml version="1.0" encoding="utf-8"?>
<Map background-color='white'>
  <FileSource name="symbols">./symbols/</FileSource>

  <Style name="style">
    <Rule>
      <LineSymbolizer stroke="blue" stroke-width="5"/>
      <ShieldSymbolizer spacing="[spacing]" base="symbols" file="motorway_2x1.svg" face-name="DejaVu Sans Book" placement="line">[spacing]</ShieldSymbolizer>
    </Rule>
  </Style>

  <Layer name="layer">
    <StyleName>style</StyleName>
    <Datasource>
      <Parameter name="type">csv</Parameter>
      <Parameter name="inline">
wkt,spacing
"LINESTRING(10 10,50 20,90 10)",30
"LINESTRING(10 20,50 30,90 20)",60
"LINESTRING(10 30,50 40,90 30)",90
      </Parameter>
    </Datasource>
  </Layer>

</Map>placement Controls where the shield is actually placed:
point-
Places the shield just once at the center of the geometry. In case of a polygon that may actually be outside of the polygon surface, depending on its shape
interior-
Similar to
point, but makes sure that the shield is placed inside a polygon even if its center point is actually on its outside line-
When
spacingis larger than zero the shield is repeatedly drawn along a line or a polygons outline withspacingpixels between shields vertex-
Tries to place the shield on each vertex point of a line or a polygons outline
grid-
When
grid-cell-widthandgrid-cell-heightare greater than zero the shield is repeatedly drawn into a polygons surface, using grid cells of the given width and height. Note that the shield is not clipped at the border of the polygon, so some shield parts may be drawn slightly outside of the polygon surface. alternating-grid-
Similar to
grid, but each second row is horizontally displaced by half ofgrid-cell-width
<?xml version="1.0" encoding="utf-8"?>
<Map background-color="white">
  <FileSource name="symbols">./symbols</FileSource>

  <Style name="style">
    <Rule>
      <LineSymbolizer stroke="blue" stroke-width="5"/>
      <ShieldSymbolizer base="symbols" file="motorway_2x1.svg" face-name="DejaVu Sans Book" placement="[placement]" grid-cell-width="30" grid-cell-height="20" spacing="30">A1</ShieldSymbolizer>
      <TextSymbolizer face-name="DejaVu Sans Book" allow-overlap="true" dy="50">[placement]</TextSymbolizer>
    </Rule>
  </Style>

  <Layer name="layer">
    <StyleName>style</StyleName>
    <Datasource>
      <Parameter name="type">csv</Parameter>
      <Parameter name="inline">
wkt,placement
"POLYGON(( 1 1, 6 1, 6 5, 5 5, 5 2, 2 2, 2 5, 1 5, 1 1))",interior
"POLYGON((11 1,16 1,16 5,                    11 5,11 1))",line
"POLYGON((21 1,26 1,26 5,                    21 5,21 1))",alternating-grid
"POLYGON(( 1 11, 6 11, 6 15, 5 15, 5 12, 2 12, 2 15, 1 15, 1 11))",point
"POLYGON((11 11,16 11,16 15,                        11 15,11 11))",vertex
"POLYGON((21 11,26 11,26 15,                        21 15,21 11))",grid
      </Parameter>
    </Datasource>
  </Layer>

</Map><?xml version="1.0" encoding="utf-8"?>
<Map background-color="white">
<FileSource name="symbols">./symbols</FileSource>
<Style name="style">
<Rule>
<LineSymbolizer stroke="lightblue" stroke-width="5"/>
<ShieldSymbolizer base="symbols" file="motorway_2x1.svg" face-name="DejaVu Sans Book" placement="[placement]" grid-cell-width="[width]" grid-cell-height="[height]" spacing="30">A1</ShieldSymbolizer>
<TextSymbolizer face-name="DejaVu Sans Book" allow-overlap="true" dy="50">[width]+","+[height]+","+[placement]</TextSymbolizer>
</Rule>
</Style>
<Layer name="layer">
<StyleName>style</StyleName>
<Datasource>
<Parameter name="type">csv</Parameter>
<Parameter name="inline">
wkt,width,height,placement
"POLYGON(( 1 1, 6 1, 6 5, 1 5, 1 1))",30,20,alternating-grid
"POLYGON((11 1,16 1,16 5,11 5,11 1))",40,20,alternating-grid
"POLYGON((21 1,26 1,26 5,21 5,21 1))",40,30,alternating-grid
"POLYGON(( 1 11, 6 11, 6 15, 1 15, 1 11))",30,20,grid
"POLYGON((11 11,16 11,16 15,11 15,11 11))",40,20,grid
"POLYGON((21 11,26 11,26 15,21 15,21 11))",40,30,grid
</Parameter>
</Datasource>
</Layer>
</Map>3.10.10. BuildingSymbolizer
The <BuildingSymbolizer> renders polygons in a very simple pseudo-3D fashion. The given fill color us used for the "roof", while its individual red, green and blue values are multiplied by 0.8 to create a more darkened tone for the "walls"
| Attribute | Value | Default |
|---|---|---|
CSS color |
gray |
|
foat |
1.0 |
|
float |
0 |
See also:
<?xml version="1.0" encoding="utf-8"?>
<Map background-color="white">

  <Style name="style">
    <Rule>
      <BuildingSymbolizer height="1" fill="[fill]"/>
      <TextSymbolizer face-name="DejaVu Sans Book" allow-overlap="true" dy="50">[fill]</TextSymbolizer>
    </Rule>
  </Style>

  <Layer name="layer">
    <StyleName>style</StyleName>
    <Datasource>
      <Parameter name="type">csv</Parameter>
      <Parameter name="inline">
wkt,fill
"POLYGON(( 1 1, 4 2, 3 4, 0 3, 1 1))",red
"POLYGON((11 1,14 2,13 4,10 3,11 1))",green
"POLYGON((21 1,24 2,23 4,20 3,21 1))",blue
      </Parameter>
    </Datasource>
  </Layer>

</Map><?xml version="1.0" encoding="utf-8"?>
<Map background-color="white">
<Style name="style">
<Rule>
<BuildingSymbolizer height="1" fill="red" fill-opacity="[opacity]"/>
<TextSymbolizer face-name="DejaVu Sans Book" allow-overlap="true" dy="50">[opacity]</TextSymbolizer>
</Rule>
</Style>
<Layer name="layer">
<StyleName>style</StyleName>
<Datasource>
<Parameter name="type">csv</Parameter>
<Parameter name="inline">
wkt,opacity
"POLYGON(( 1 1, 4 2, 3 4, 0 3, 1 1))",0.2
"POLYGON((11 1,14 2,13 4,10 3,11 1))",0.5
"POLYGON((21 1,24 2,23 4,20 3,21 1))",0.8
</Parameter>
</Datasource>
</Layer>
</Map><?xml version="1.0" encoding="utf-8"?>
<Map background-color="white">
<Style name="style">
<Rule>
<BuildingSymbolizer height="[height]"/>
<TextSymbolizer face-name="DejaVu Sans Book" allow-overlap="true" dy="50">[height]</TextSymbolizer>
</Rule>
</Style>
<Layer name="layer">
<StyleName>style</StyleName>
<Datasource>
<Parameter name="type">csv</Parameter>
<Parameter name="inline">
wkt,height
"POLYGON(( 1 1, 4 2, 3 4, 0 3, 1 1))",1
"POLYGON((11 1,14 2,13 4,10 3,11 1))",2
"POLYGON((21 1,24 2,23 4,20 3,21 1))",3
</Parameter>
</Datasource>
</Layer>
</Map>3.10.11. GroupSymbolizer
3.10.12. DotSymbolizer
…TODO…
| Attribute | Type | Default | Description |
|---|---|---|---|
|
float |
1.0 |
|
|
float |
1.0 |
|
|
color |
gray |
|
|
float |
1.0 |
|
|
string |
src-over |
TODO: "dot=list" (see http://mapnik.org/mapnik-reference/#3.0.22/dot )
<?xml version="1.0" encoding="utf-8"?>
<Map background-color="white">
  <FileSource name="symbols">./symbols</FileSource>

  <Style name="style">
    <Rule>
      <DotSymbolizer height="[height]" width="[width]" fill="red"/>
      <TextSymbolizer face-name="DejaVu Sans Book" allow-overlap="true" dy="20">[width]+","+[height]</TextSymbolizer>
    </Rule>
  </Style>

  <Layer name="layer">
    <StyleName>style</StyleName>
    <Datasource>
      <Parameter name="type">csv</Parameter>
      <Parameter name="inline">
wkt,width,height
"POINT(0 0)",10,10
"POINT(1 0)",20,10
"POINT(2 0)",10,20
      </Parameter>
    </Datasource>
  </Layer>

</Map>
4. Tools
4.1. Mapnik tools
4.1.1. mapnik-index
TODO - this is an almost undocumented tool meant to improve the processing of CSV and GeoJSON files somehow
4.1.2. shapeindex
TODO - this is an almost undocumented tool meant to improve the processing of shapefiles somehow
4.2. OpenStreetMap tools
While OpenStreetMap data files can be processed directly using the OGR <Datasource> this only really works out for rather small files / areas.
To cover larger areas, and especially the full planet, OSM data is usually pre-processed and stored in a database more suitable for processing by a renderer.
The two main tools used to do so are osm2pgsql and imposm, with the former one seeming to be the far more popular one by now.
4.2.1. osm2pgsql
osm2pgsql is used by many projects, including the OpenStreetMap Carto style used to generate the default map tiles on the OpenStreetMap website itself.
Databases imported by it are usually well suited for use in combination with the PostGIS data source plugin.
For details see: https://osm2pgsql.org/
4.2.2. imposm
4.3. Style tools
4.3.1. carto
carto is a tool that parses CartoCSS stylesheets and converts them into Mapnik XML.
Many OpenStreetMap styles these days are actually implemented using CartoCSS, and not the Mapnik XML syntax directly, including the OpenStreetMap Carto default style.
See also: https://github.com/mapbox/carto
4.3.2. Kosmtik
Kosmtik is a Javascript based graphical tool for developing CartoCSS stylesheets in a more "what you see is what you get" way than the classic approach to edit Mapnik XML or CartoCSS stylesheets directly with a text editor.
See also: https://github.com/kosmtik/kosmtik
5. Compositing
TODO: extend OSM default style with a big single red dot marker, similar to CartoCSS example page
All examples below basically use the same XML stylesheet, with just the comp-op attribute for the red dots layer changed.
<?xml version="1.0" encoding="utf-8"?>
<Map background-color='blue'>
  <FileSource name="symbols">./symbols</FileSource>

  <Style name="countries">
    <Rule>
      <PolygonSymbolizer fill="green"/>
    </Rule>
  </Style>

  <Layer name="countries">
    <StyleName>countries</StyleName>
    <Datasource>
      <Parameter name="type">shape</Parameter>
      <Parameter name="file">data/ne_110m_admin_0_countries.shp</Parameter>
    </Datasource>
  </Layer>

  <Style name="style" comp-op="difference">
    <Rule>
      <PointSymbolizer allow-overlap="true" base="symbols" file="red/dot.svg"/>
    </Rule>
  </Style>

  <Layer name="layer">
    <StyleName>style</StyleName>
    <Datasource>
      <Parameter name="type">csv</Parameter>
      <Parameter name="inline">
wkt
"POINT(1 1)"
      </Parameter>
    </Datasource>
  </Layer>
</Map>
5.1. clear

5.2. color-burn
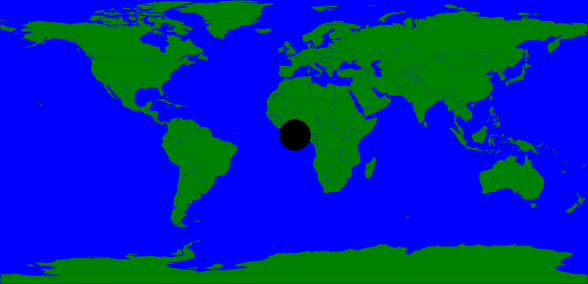
5.3. color-dodge
5.4. darken
5.5. difference
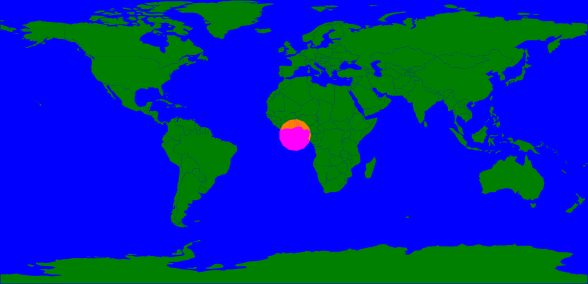
5.6. dst-atop

5.7. dst-in

5.8. dst-out
5.9. dst-over
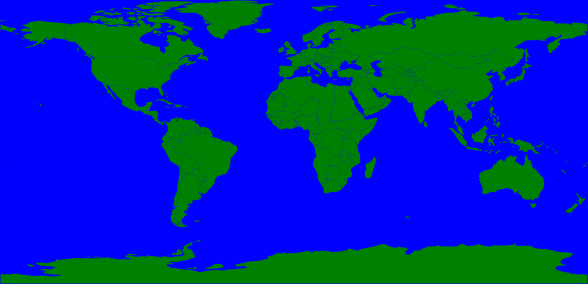
5.10. dst
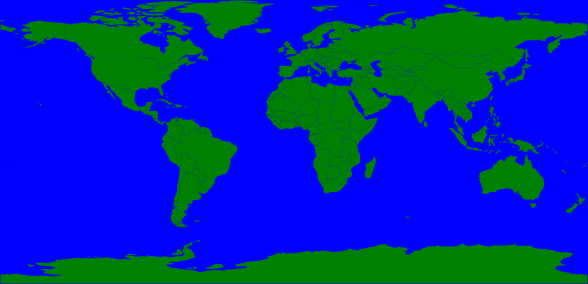
5.11. exclusion
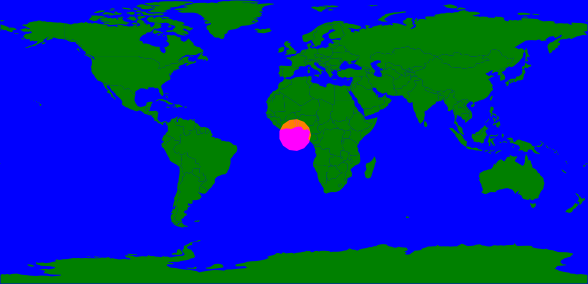
5.12. hard-light
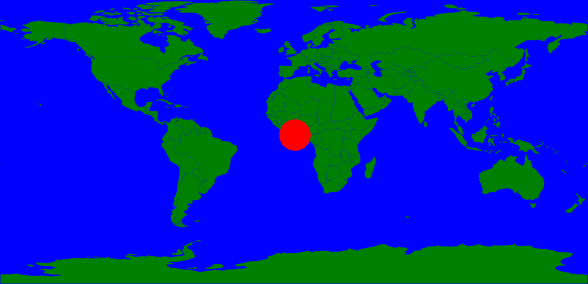
5.13. lighten
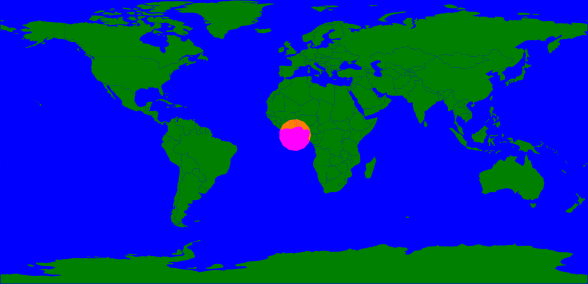
5.14. multiply
5.15. overlay

5.16. plus
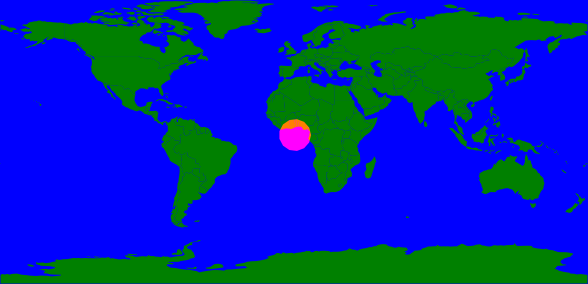
5.17. screen

5.18. soft-light
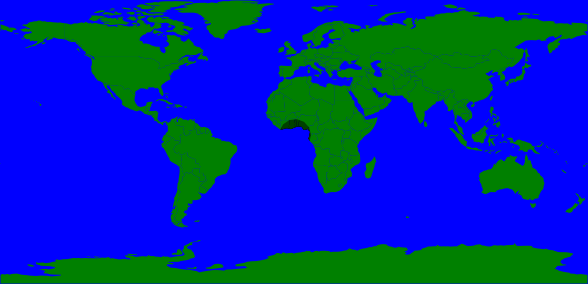
5.19. src-atop
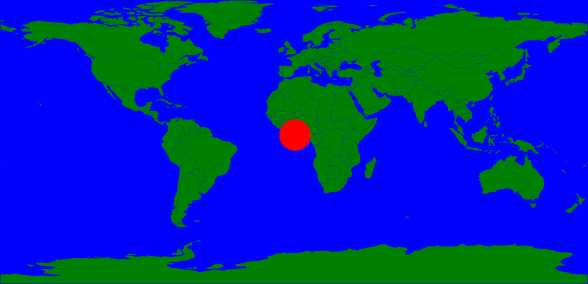
5.20. src-in

5.21. src-out

5.22. src-over
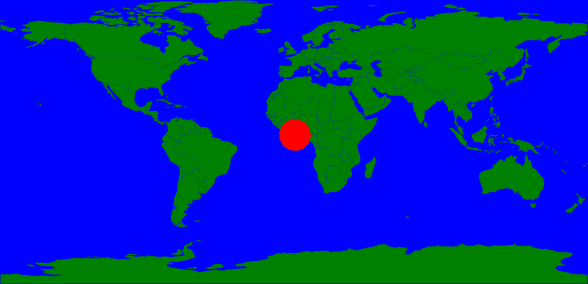
5.23. src

5.24. xor
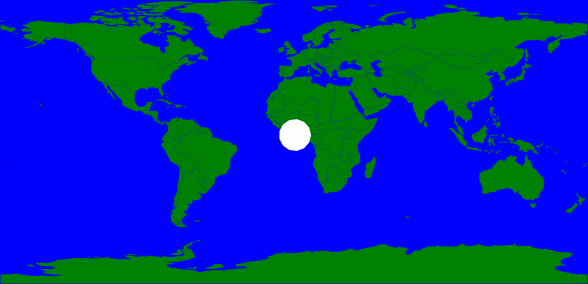
6. Tips and Tricks
6.1. SVG and PDF document versions
When using default settings, CairoGraphics will create SVG version 1.1 output. This SVG version does not support all available composite operator choices (comp-op) though, and so for some comp-op values used in style sheets Cairo will fall back to bitmap rendering and you will end up with a SVG document that only contains one single image tag, and the actual rendered map being one large embedded bitmap image.
To prevent this you need to explicitly set the SVG version to produce to version 1.2:
surface.restrict_to_version(cairo.SVGVersion.VERSION_1_2);
Same for PDF, here you need to enforce the use of PDF version 1.5:
surface.restrict_to_version(cairo.PDFVersion.VERSION_1_5);
TODO: Cairo version dependency
6.2. Make SVG output a bit more editor friendly
SVG created by the CairoGraphics render backend is not really made for being post-processed by a vector graphics program like e.g. InkScape. The generated SVG is completely unstructured and does not really contain any grouping or layers.
To make things even worse any text output is done by emitting single character glyphes. So when trying to post process SVG results by moving some label texts around, you need to take care of selecting every character individually.
The Mapnik Group Text tool by Ilya Zverev. It finds letters and their casing in the generated SVG, tries to find words they form, and then groups the letters per word so that you can easily move words as a whole instead of individual letters.
6.3. Simplify SVG
Mapnik only supports a subset of SVG when it comes to marker images so far.
When creating images with InkScape, make sure to save your images as "Plain SVG", not "InkScape SVG". Even with that some unsupported constructs may end upSVG files though.
The same is also true for SVG images from other sources.
When it comes to simple unknown attributes Mapnik will throw a warning, but the result will usually still come out OK. In other cases you may end up with weird looking results though. And even when everything looks fine in the end, the emitted warnings can still be annoying, and may hide other, more importantn warnings.
TODO: simple script to resolve the most common cases.
6.4. Mapnik and Cairo Graphics
Mapnik does not only support using Cairo Graphics as a render backend for direct output, it can also be told to render into a cairo surface object. So it can be used to combine mapnik map output with other graphical elements generated by cairo graphics calls.
One example that makes use of this is MapOSMatic, which adds things like a map title, copyright and attribution footer, and an optional street index sidebar, around a mapnik generated map, or even creates multi page PDF books with one mapnik map rendered on each page.
7. Resources
7.1. Mapnik styles
This is an (incomplete) list of styles for Mapnik that are available under an open source license. The list includes 'pure' Mapnik XML styles, and styles that can easily be converted to Mapnik XML, like those using CartoCSS.
Most Styles fall into two basic categories when it comes to their main data source, they either use derivations of the osm2pgsql schema used by the OpenStreetMap CartoCSS style, or customized imposm import schemas.
Most styles also use shapefiles for some of their layers, openly available shapefiles are list in the Shapefiles section.
Some styles are base map styles that aim at providing a full featured map, while others are only meant to be used to generated overlays that add some specific type of information on top of the output of another base style as an overlay.
| Name | Type | Maintained | Language | Data source | License | Description |
|---|---|---|---|---|---|---|
base |
yes |
Carto CSS |
|
CC0 |
The current default OpenStreetMap style |
|
Mapnik OSM |
base |
no |
MapnikXML |
|
? |
Older OpenStreetMap style that was eventually replaced by OpenStreetMap Carto |
base |
yes |
CartoCSS |
|
CC0 |
Based on OSM Carto, but with an alternative color scheme |
|
base |
yes |
Carto CSS |
|
CC-BY-SA |
A topographic style focused on the Ardenne area in Belgium |
|
base |
yes |
CartoCSS |
|
CC0 |
Belgian variant of OSM Carto, also comes with all-dutch and all-french variants |
|
base |
no |
Carto CSS |
|
BSD? |
A low contrast style based on OSM Bright and Pandonia |
|
base |
yes |
Carto CSS |
|
BSD |
A map style focused on cyclists |
|
French |
base |
|||||
base |
yes |
Carto CSS |
|
CC0 |
Based on OSM Carto, but using colors and symbols more common to German maps |
|
HikeBike |
base |
no |
Carto CSS |
|
CC0 |
A map style focused on cyclists |
base |
yes |
Carto CSS |
The Humanitarian OpenStreetMap style |
|||
base |
no |
Mapnik XML |
|
MIT |
Old MapQuest styles from around 2010 |
|
base |
no |
Carto CSS |
|
WTFPL |
A map for navigating waterways |
|
base |
no? |
Carto CSS |
|
BSD |
A rather low contrast style, meant to be used as base for own styles |
|
base |
no |
Carto CSS |
|
BSD? |
A low contrast style based on OSM Bright, originally created by Flickr |
|
base |
no |
Carto CSS |
Mapbox Studio |
BSD |
Artistic style looking like hand drawn with a pencil (a https://github.com/hholzgra/mapbox-studio-pencil.tm2/commits/dev-osm2pgsql[fork using |
|
base |
no? |
Mapnik XML |
|
? |
A style optimized for winter sports |
|
base |
yes? |
Carto CSS |
|
BSD |
Another low contrast style based on OSM Bright |
|
base |
no |
Carto CSS |
|
CC-BY-SA |
A style specific to Switzerland, based on OSM Bright |
|
base |
yes |
Carto CSS |
|
ISC |
A high contrast pure black&white style, originaly created by Stamen and now maintained by Geofabrik |
|
base |
yes? |
Carto CSS |
|
WTFPL |
A style focussing on bike infrastructure in Russia |
|
base |
no |
Carto CSS |
Mapbox Studio |
BSD |
Artistic style meant to look like space station surface (a https://github.com/hholzgra/mapbox-studio-space-station.tm2/tree/dev-osm2pgsql[fork using |
|
7.2. Shapefiles
Open/free shapefiles are available from multiple sources, including OpenStreetMap, Natural Earth, and others.
7.2.1. OpenStreetMap Data
OpenStreetMap Data provides some shapefiles generated from OpenStreetMap data on a regular basis. Compared to raw OSM data these contain data that has been checked for consistency. So when e.g. using the land polygon or water polygon shapefile you won’t end up with all of Europe suddenly flooded due to a small coast segment temporarily missing.
7.2.2. OpenStreetMap Historical
OpenStreetMap still provides some historical shapefiles that are used by some older Mapnik styles. These files are no longer regenerated from current data, and should not be used when creating new styles. There are only kept around for historic backwards compatibility reasons.
7.2.3. Natural Earth
Natural Earth provides a lot of free vector and raster map data sets at 1:10m, 1:50m, and 1:110m scales. Data is divided in two general categories: physical and cultural, with lots of interesting and useful feature files below these categories.
All data provided by Natural Earth is in the public domain (CC0).
7.2.4. Geofabrik
Geofabrik Downloads do not only provide daily OSM data extracts for continents, countries, and regions, but also shapefiles with selected feature layers for most of these. When running small scale local applications, these can be an alternative to importing OSM data into a database server.
8. Glossary
- AGG
-
The Anti-Grain Graphics library used by default for bitmap (PNG, JPEG, …) output.
- Cairo
- CairoGraphics
-
The Cairo Graphics library used for vector format output (SVG, PDF, PS) output by default, and also for bitmap output when esplicitly requested.
- Compositing
-
Compositing provides different ways to combine data to be drawn with already existing from drawing previous layers.
- GDAL
-
GDAL is a library for processing various raster and vector geospatial data formats released by the Open Source Geospatial Foundation (OSGeo). The vector format support also runs under the name OGR for historical reasons.
- GPS
-
Global Positioning System
- GPX
-
GPS exchange format - an XML format to represent GPS data.
- Harfbuzz
-
Harfbuzz is a Text rendering / shaping library used by Mapnik starting with V3.0
- Imposm
-
Imposm is a toll to import OpenStreetMap data into a PostGIS database. (See also: Osm2pgsql)
- MapOSMatic
-
A web frontend and render backend to generate printable map posters and booklets using Mapnik, Python and Cairo Graphics
- Opacity
-
Defines how opaque or transparent a feature should be. Values range from 0.0 for total transparency to 1.0 for total opacity.
- OGR
-
The vector format related part of GDAL.
- OSGeo
osm2pgsql-
Osm2pgsql is a tool to import OpenStreetMap data into a PostGIS database. It is part of the tool chain used to generated the map tiles provided on
openstreetmap.org. (see also: Imposm) - PBF
-
Protocol Buffer Format - a file format for OSM data based on the Google ProtoBuf library. PBF is a binary format not suitable for human readning, but very compact, with file sizes typically only almost half of bzip2 compressed OSM XML.
- Symbolizer
-
A symbolizer describes how features appear on rendered maps.
- SVG Transformations
-
SVG transformations allow to translate, scale, rotate or skew a shape, either by combining one or more individual operations, or by giving them as a transformation matrix right away.
Bibliography
Asorted articles
-
[r:mapnik-wiki] Mapnik Wiki
9. License
Basically the FreeBSD Documentation License:
Copyright 2020-2022 Hartmut Holzgraefe. All rights reserved.
Redistribution and use in source (AsciiDoc) and 'compiled' forms (HTML, PDF, EPUB and so forth) with or without modification, are permitted provided that the following conditions are met:
-
Redistributions of source code (AsciiDoc) must retain the above copyright notice, this list of conditions and the following disclaimer as the first lines of this file unmodified.
-
Redistributions in compiled form (Converted to PDF, EPUB and other formats) must reproduce the above copyright notice, this list of conditions and the following disclaimer in the documentation and/or other materials provided with the distribution.
THIS DOCUMENTATION IS PROVIDED BY THE AUTHOR(S) "AS IS" AND ANY EXPRESS OR IMPLIED WARRANTIES, INCLUDING, BUT NOT LIMITED TO, THE IMPLIED WARRANTIES OF MERCHANTABILITY AND FITNESS FOR A PARTICULAR PURPOSE ARE DISCLAIMED. IN NO EVENT SHALL THE AUTHOR(S) BE LIABLE FOR ANY DIRECT, INDIRECT, INCIDENTAL, SPECIAL, EXEMPLARY, OR CONSEQUENTIAL DAMAGES (INCLUDING, BUT NOT LIMITED TO, PROCUREMENT OF SUBSTITUTE GOODS OR SERVICES; LOSS OF USE, DATA, OR PROFITS; OR BUSINESS INTERRUPTION) HOWEVER CAUSED AND ON ANY THEORY OF LIABILITY, WHETHER IN CONTRACT, STRICT LIABILITY, OR TORT (INCLUDING NEGLIGENCE OR OTHERWISE) ARISING IN ANY WAY OUT OF THE USE OF THIS DOCUMENTATION, EVEN IF ADVISED OF THE POSSIBILITY OF SUCH DAMAGE.